This site uses cookies. By continuing to browse the ConceptDraw site you are agreeing to our Use of Site Cookies.

BCG Matrix

The growth–share matrix (BCG Matrix) was created by Bruce D. Henderson for the Boston Consulting Group in 1970 to help corporations to analyze their business units and to help the company allocate resources. How is it easy design the BCG Matrices in ConceptDraw DIAGRAM diagramming and vector drawing software supplied with unique Matrices Solution from the Marketing Area of ConceptDraw Solution Park.

Growth-Share Matrix Software

Growth-Share Matrix Software - ConceptDraw DIAGRAM is a powerful diagramming and vector drawing software for creating professional looking Growth–Share Matrices. For simple and quick creating the Growth–Share Matrix ConceptDraw DIAGRAM offers the Matrices Solution from the Marketing Area of ConceptDraw Solution Park.
The Matrices Solution also provides a wide variety of templates and samples that will help you to create the Matrix diagrams of any difficulty.

Matrices

ConceptDraw DIAGRAM extended with Matrices Solution from the Marketing Area of ConceptDraw Solution Park is a powerful software for drawing various types of Marketing Matrices: Ansoff Matrix, BCG Matrix, Deployment Chart, Feature Comparison Chart, Competitive Strategies Matrix, Flow Process Chart, Porter's Value Chain Diagram, Positioning Map, and many others.

Matrix Organization Structure

Matrix organizational structure is one of the main forms of structures which is actively used by organizations to carry forth the functions of a company visually and effectively.
Now we have ConceptDraw DIAGRAM diagramming and vector drawing software extended with 25 Typical Orgcharts solution from the Management area of ConceptDraw Solution Park which will help easy represent matrix organizational structure of any degree of complexity.

Positioning Map

ConceptDraw DIAGRAM is a powerful diagramming and vector drawing software. Extended with Matrices Solution from the Marketing Area of ConceptDraw Solution Park it became the best software for quick and easy designing various types of Matrix Diagrams, including Positioning Map.

marketing matrix diagram, marketing matrices, positioning map Matrices

marketing matrix diagram, marketing matrices, positioning map
This solution extends ConceptDraw DIAGRAM software with samples, templates and library of design elements for drawing the business matrix diagrams.

Ansoff Matrix

ConceptDraw DIAGRAM software extended with Matrices Solution from the Marketing Area of ConceptDraw Solution Park offers you the possibility to develop the Ansoff Matrix of any complexity.

SWOT matrix template

SWOT matrix templates is part of SWOT Analysis solution from ConceptDraw Solution Park.

Business Tools Perceptual Mapping

This sample shows the Perceptual map. It was created in ConceptDraw DIAGRAM diagramming and vector drawing software using the Matrices Solution from the Marketing area of ConceptDraw Solution Park.
Perception Mapping helps organizations measure and transform all aspects of their business, people and culture. Perception Mapping allows to represent the complex relationships graphically, helps identify potential problems of the organization and make the best decisions.

Swot Analysis Examples for Mac OSX

SWOT Analysis solution from ConceptDraw Solution Park extends ConceptDraw MINDMAP and ConceptDraw DIAGRAM software with easy-to-use SWOT Analysis tools for Mac OSX and Windows.

Deployment Chart Software

ConceptDraw DIAGRAM extended with Matrices solution from the Marketing area of ConceptDraw Solution Park is the best Deployment Chart Software.
The Matrices solution offers you the useful tools for creating Deployment Charts in just minutes.
The Deployment Charts designed with ConceptDraw DIAGRAM are vector graphic documents and are available for reviewing, modifying, converting to a variety of formats (image, HTML, PDF file, MS PowerPoint Presentation, Adobe Flash or MS Visio XML), printing and send via e-mail in one moment.
HelpDesk

How To Create an Involvement Matrix

The Involvement Matrix can identify the distribution of responsibilities and identify roles in a group or team. This matrix can be used company-wide. The Involvement Matrix identifies participants who are involved in corrective actions. The Involvement Matrix is constructed for all highly prioritized corrective actions. It uses symbols to assign who participates, performs, consults, should be informed, checks the work, and accepts the results. Using visual diagrams keeps ideas clear and is very effective when discussing the problem and a description of the solution. They are great at helping to quickly see what stage of the problem-solving effort is currently underway. It defines the participants and their roles. The matrix displays all of the parties involved, defines their level of involvement, and the nature of their participation. The ability to create an Involvement Matrix is supported by the ConceptDraw Seven Management and Planning Tools solution.

Flowchart Marketing Process. Flowchart Examples

This sample shows the Flowchart that displays the layout and work flow of the cloud marketing platform. This diagram has a style of the marketing brochure. This style displays the central product that is related to the other issues.
Using the ready-to-use predesigned objects, samples and templates from the Flowcharts Solution for ConceptDraw DIAGRAM you can create your own professional looking Flowchart Diagrams quick and easy.
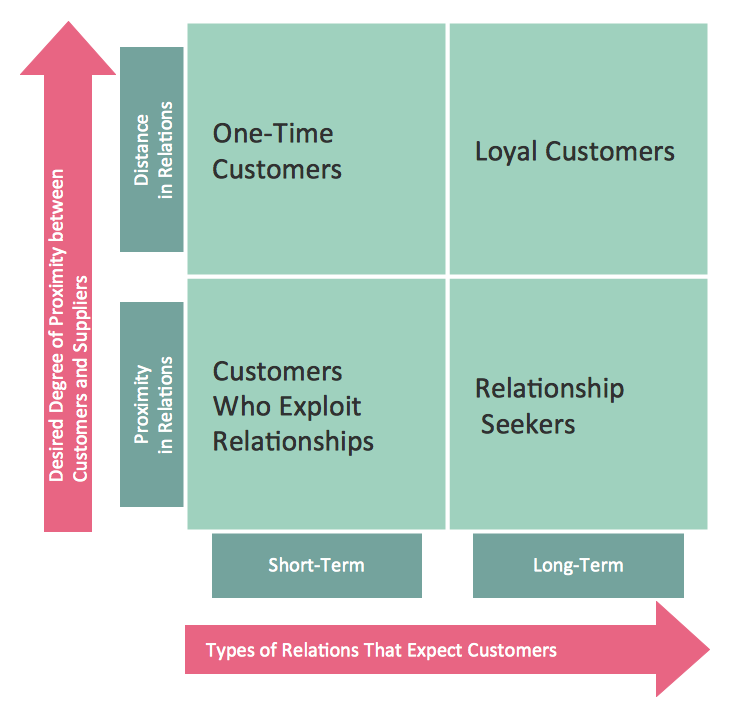
This customer types matrix diagram distribute customers into four categories depending of two criteria: 1) desired degree of proximity between customers and suppliers, and 2) types of relations that expect customers.
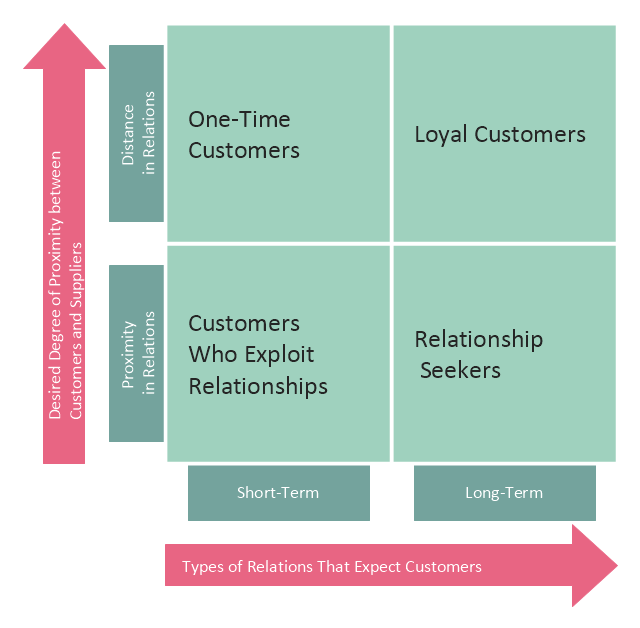
One time customers have short-term relations with suppliers and characterized by distance in relations with them.
Loyal customers have long-term relations with suppliers and characterized by distance in relations with them.
Customers who exploit relationships have short-term relations with suppliers and characterized by proximity in relations with them.
Relationship seekers have long-term relations with suppliers and characterized by proximity in relations with them.
This customer types matrix diagram example was created using the ConceptDraw PRO diagramming and vector drawing software extended with the Matrices solution from the Marketing area of ConceptDraw Solution Park.
Customer types diagram
Customer types diagram, four-quadrant matrix,
Used Solutions

Competitor Analysis

Competitor analysis is a first and obligatory step in elaboration the proper corporate marketing strategy and creating sustainable competitive advantage. Use powerful opportunities of numerous solutions from ConceptDraw Solution Park for designing illustrative diagrams, charts, matrices which are necessary for effective competitor analysis.