Fault Tree Diagram

PROBLEM ANALYSIS. Root Cause Analysis Tree Diagram


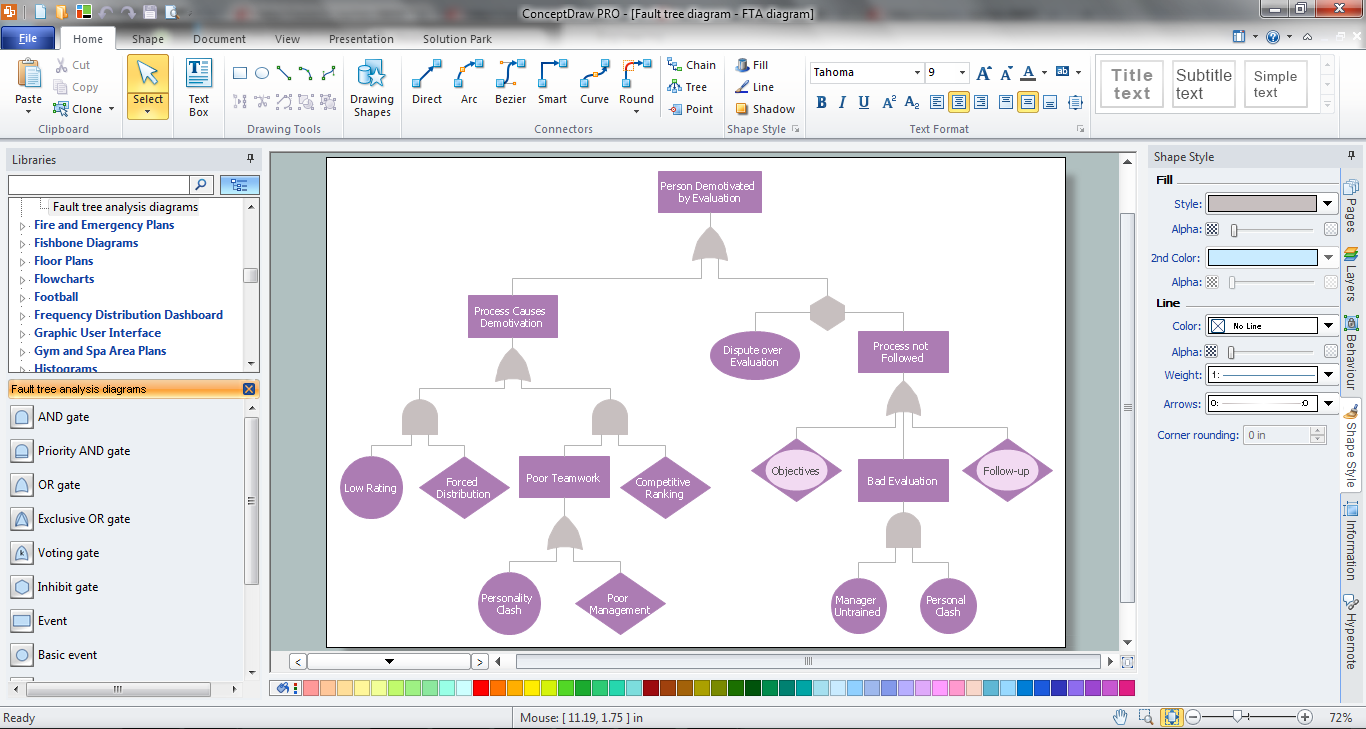
 Fault Tree Analysis Diagrams
This solution extends ConceptDraw DIAGRAM.5 or later with templates, fault tree analysis example, samples and a library of vector design elements for drawing FTA diagrams (or negative analytical trees), cause and effect diagrams and fault tree diagrams.
HelpDesk
How to Create a Fault Tree Analysis Diagram (FTD)

HelpDesk
How To Create Root Cause Analysis Diagram Using Solutions

Root Cause Tree Diagram

Fault Tree Analysis Software
Tree Network Topology Diagram

PDPC

Influence Diagram Software

- Visio Tree Diagram
- Fault Tree Diagram | MS Visio Look a Like Diagrams | Is ...
- MS Visio Look a Like Diagrams | Decision Tree Diagram Visio
- Root cause analysis tree diagram - Template | Fault Tree Diagram ...
- Decision tree diagram | ConceptDraw Arrows10 Technology | MS ...
- Decision tree diagram | Marketing Diagrams | MS Visio Look a Like ...
- Fault Tree Diagram | Marketing Charts | IDEF0 Visio | Decision Tree ...
- MS Visio Look a Like Diagrams | IDEF0 Visio | ConceptDraw PRO ...
- PROBLEM ANALYSIS. Root Cause Analysis Tree Diagram ...
- Fault Tree Analysis Visio Sample