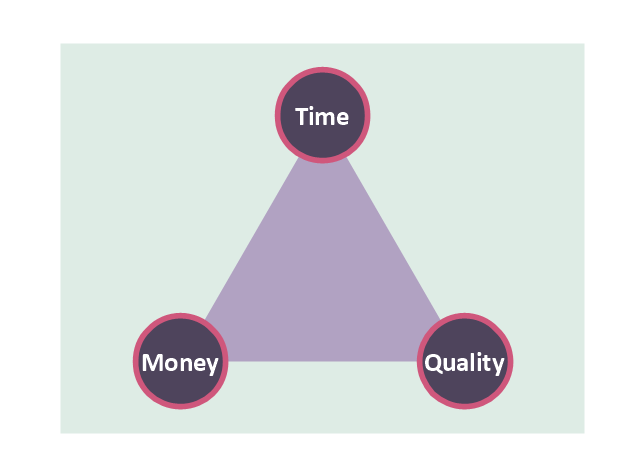
"The Time/ Money/ Quality Triangle illustrates an advertising truism, that "you can't have all three." If there is little time or money, then ad quality will suffer. The more time and/ or money that is available to the project, the higher the quality can be. However, the level of quality must be appropriate to the product...not all products should have high-quality ads!" [Advertising/ Strategies. Wikibooks]
This triangular diagram example was redesigned using the ConceptDraw PRO diagramming and vector drawing software from Wikimedia Commons file Time-Quality-Money.png. [commons.wikimedia.org/ wiki/ File:Time-Quality-Money.png]
This file is licensed under the Creative Commons Attribution-Share Alike 3.0 Unported license. [creativecommons.org/ licenses/ by-sa/ 3.0/ deed.en]
The chart sample "Time, quality, money triangle diagram" is included in the Pyramid Diagrams solution from the Marketing area of ConceptDraw Solution Park.
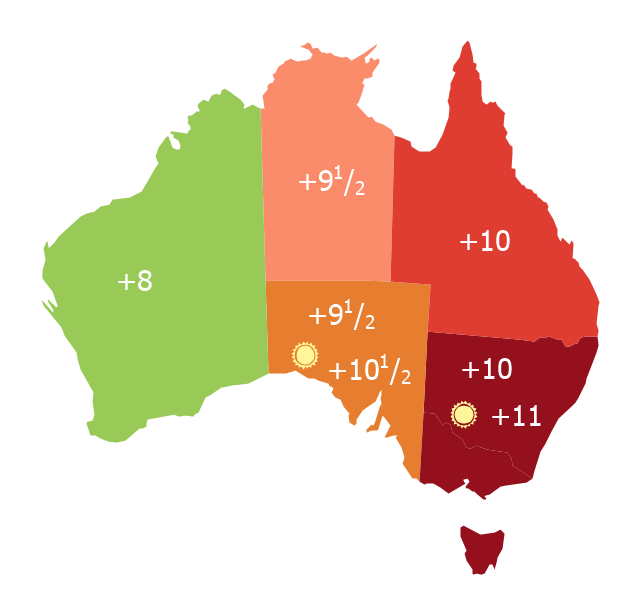
Map of Australia depicting time zones offsets from UTC by state (including daylight saving).
"Time in Australia uses more than three time zones, including Australian Western Standard Time (AWST; UTC+08:00), Australian Central Standard Time (ACST; UTC+09:30), and Australian Eastern Standard Time (AEST; UTC+10:00). Time is regulated by the individual state governments, some of which observe daylight saving time (DST). Australia's external territories observe different time zones." [Time in Australia. Wikipedia]
This thematic map was redesigned from Wikipedia file: Australia states timezones.png. [commons.wikimedia.org/ wiki/ File:Australia-states-timezones.png]
This file is licensed under the Creative Commons Attribution-Share Alike 3.0 Unported license.
[creativecommons.org/ licenses/ by-sa/ 3.0/ deed.en]
The thematic map example "Australia states time zones" was created using the ConceptDraw PRO diagramming and vector drawing software extended with the Continent Maps solution from the Maps area of ConceptDraw Solution Park.
Pyramid Diagram
The Time-Money-Quality Triangle illustrates an advertising truism, that you can't have all three.The vector stencils library "Time" contains 20 time and clock icons.
Use it to design your business and finance illustrations and infographics with ConceptDraw PRO diagramming and vector drawing software.
The vector stencils library "Time" is included in the Business and Finance solution from the Illustration area of ConceptDraw Solution Park.
Use it to design your business and finance illustrations and infographics with ConceptDraw PRO diagramming and vector drawing software.
The vector stencils library "Time" is included in the Business and Finance solution from the Illustration area of ConceptDraw Solution Park.
Time - Design Elements
Many of us want to be able to create designs efficiently yet quickly. ConceptDraw DIAGRAM will help you to make awesome drawings without having to design all those Time Elements. These elements include graphs, symbols, cliparts, visual data representation and a whole lot of other stuff.The vector stencils library "Time and clock pictograms" contains 20 time pictograms: clocks, calendars, day, week, bell, alarm clock, hourglass, wristwatch, and time intervals symbols.
Use it to create temporal infographic, illustrations and diagrams.
The example "Time and clock pictograms - Vector stencils library" was created using the ConceptDraw PRO diagramming and vector drawing software extended with the Pictorial infographics solution from the area "What is infographics" in ConceptDraw Solution Park.
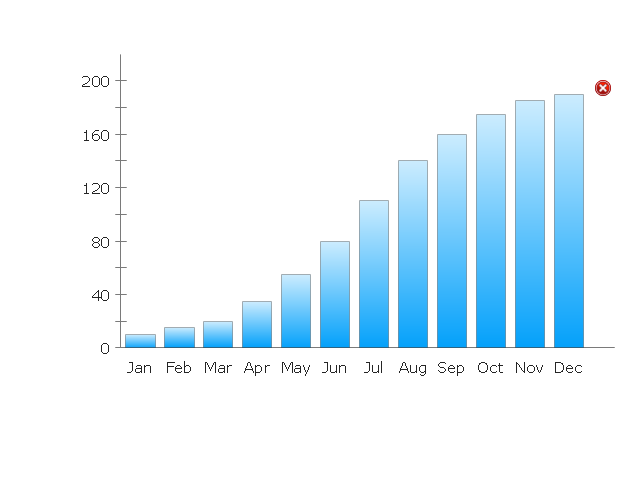
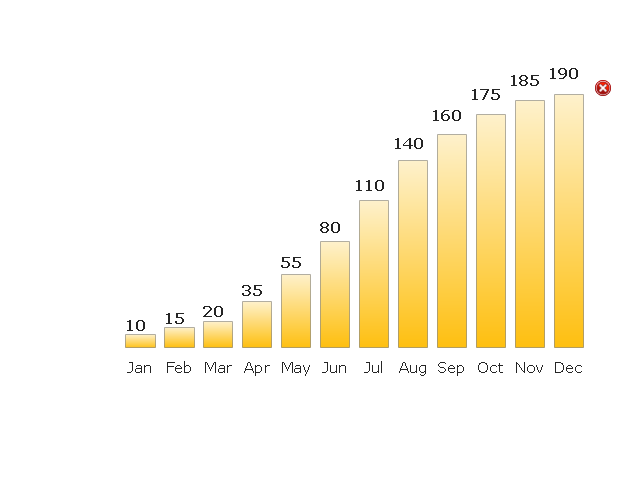
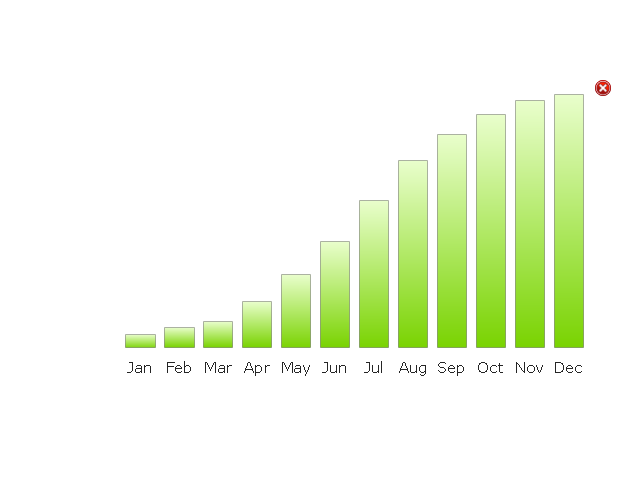
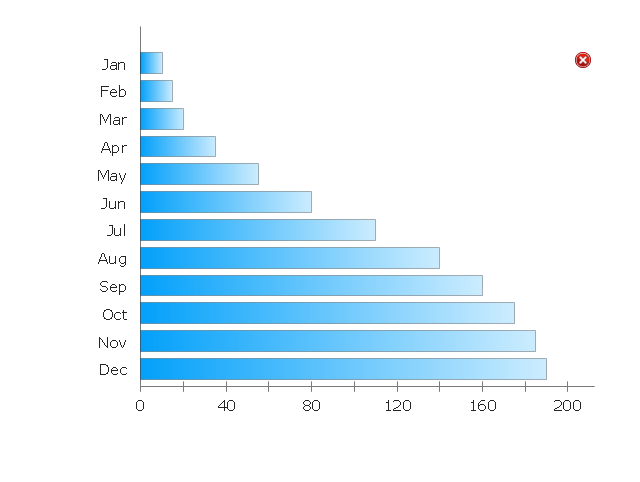
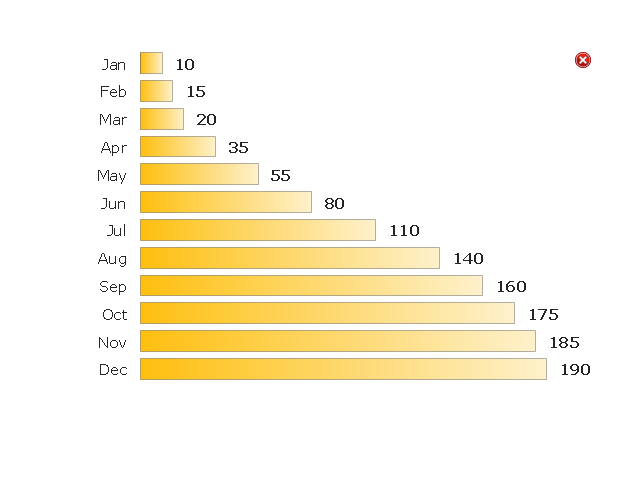
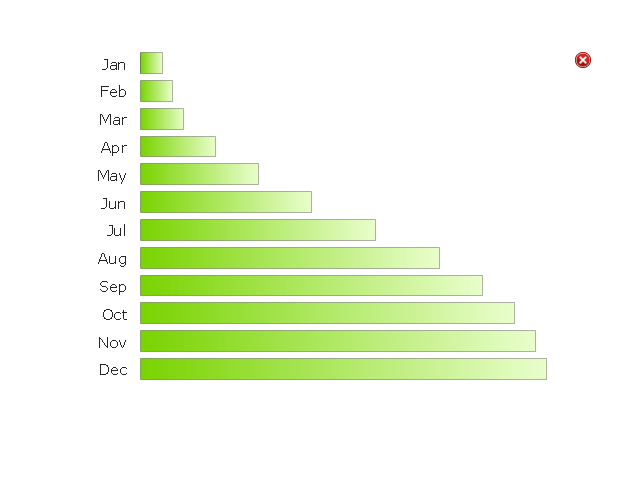
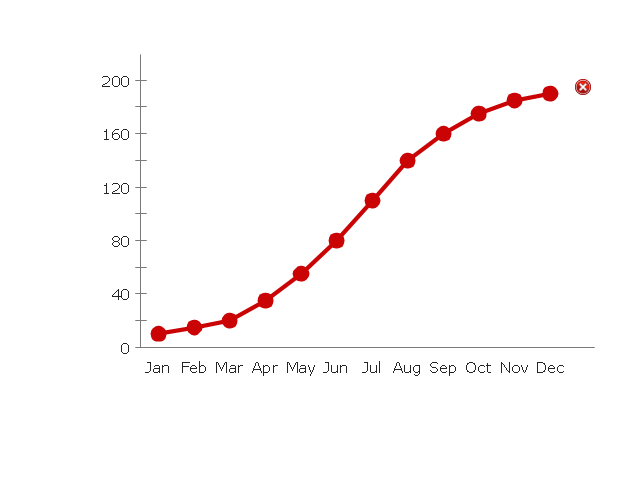
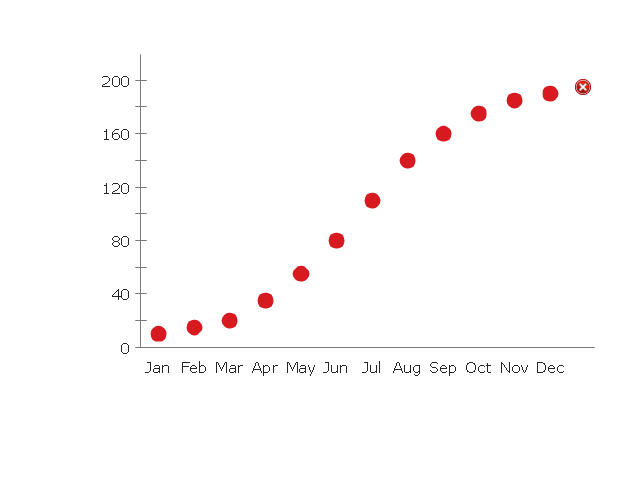
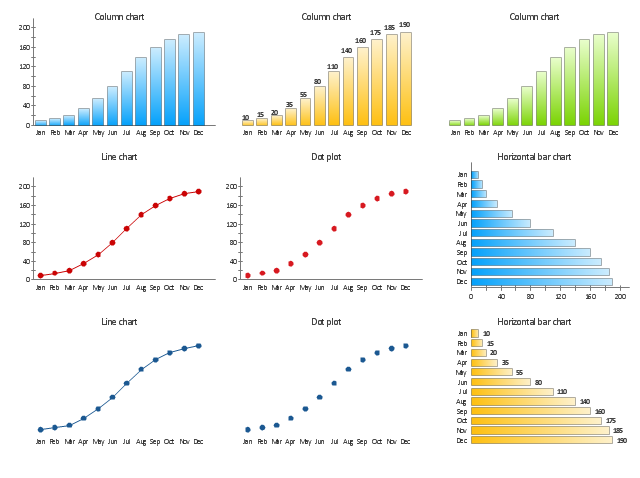
The vector stencils library "Time series charts" contains 10 templates of time series charts: 3 column charts, 3 bar charts, 2 line graphs and 2 dot plots. All these time series charts are Live Objects displaying the data from external data source files.
Use this library to create your visual dashboards in the ConceptDraw PRO diagramming and vector drawing software extended with the Time Series Dashboard solution from the area "What is a Dashboard" of ConceptDraw Solution Park.
Use this library to create your visual dashboards in the ConceptDraw PRO diagramming and vector drawing software extended with the Time Series Dashboard solution from the area "What is a Dashboard" of ConceptDraw Solution Park.
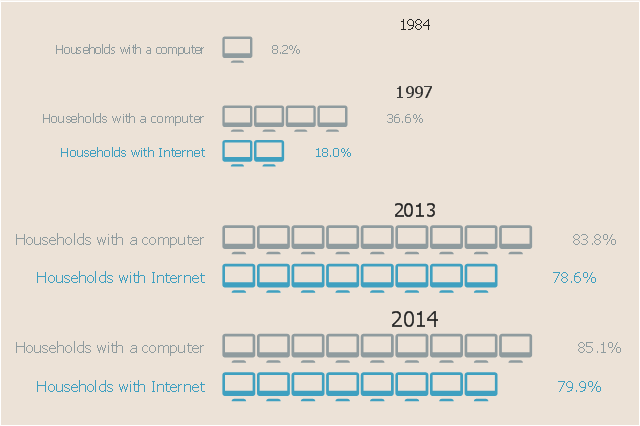
This picture bar graph sample shows the computer and Internet use at home from 1984 to 2014. It was designed using data from website of the United States Census Bureau (USCB).
[census.gov/ content/ dam/ Census/ library/ visualizations/ 2016/ comm/ digital_ nation.png]
"Home automation is the residential extension of building automation and involves the control and automation of lighting, heating, ventilation, air conditioning (HVAC), appliances, and security. Modern systems generally consist of switches and sensors connected to a central hub sometimes called a "gateway" from which the system is controlled with a user interface that is interacted either with a wall-mounted terminal, mobile phone software, tablet computer or a web interface." [Home automation. Wikipedia]
The pictorial chart example "Computer and Internet use at home over time" was created using the ConceptDraw PRO diagramming and vector drawing software extended with the Picture Graphs solution from the Graphs and Charts area of ConceptDraw Solution Park.
Geo Map - Asia - Papua New Guinea
Papua New Guinea, officially named the Independent State of Papua New Guinea, is a country in Oceania that occupies the eastern half of the island of New Guinea (the western portion of the island is a part of the Indonesian provinces of Papua and West Papua) and numerous offshore islands. The vector stencils library Papua New Guinea contains contours for ConceptDraw DIAGRAM diagramming and vector drawing software. This library is contained in the Continent Maps solution from Maps area of ConceptDraw Solution Park.The vector stencils library "HR symbols" contains 45 HR pictograms.
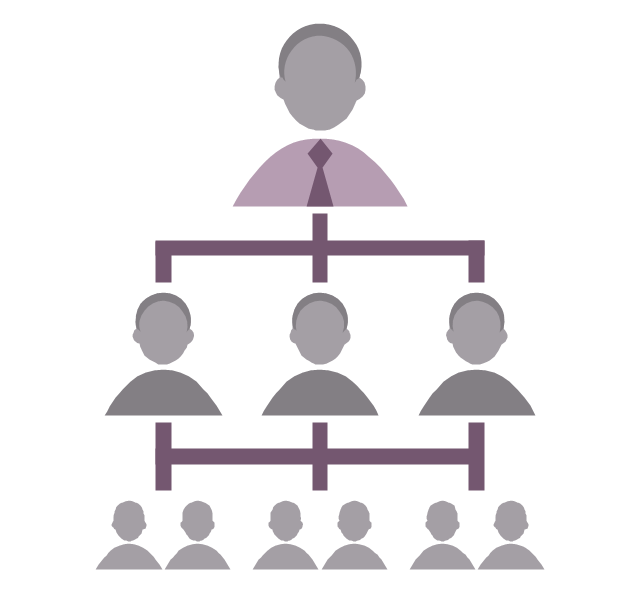
Use this icon set with HR symbols to draw your HR flowcharts, workflow diagrams, process charts and infographics with the ConceptDraw PRO diagramming and vector drawing software.
The HR pictograms library "HR symbols" is included in the HR Flowcharts solution from the Management area of ConceptDraw Solution Park.
"A chart can take a large variety of forms, however there are common features that provide the chart with its ability to extract meaning from data.
Typically the data in a chart is represented graphically, since humans are generally able to infer meaning from pictures quicker than from text. Text is generally used only to annotate the data.
One of the more important uses of text in a graph is the title. A graph's title usually appears above the main graphic and provides a succinct description of what the data in the graph refers to.
Dimensions in the data are often displayed on axes. If a horizontal and a vertical axis are used, they are usually referred to as the x-axis and y-axis respectively. Each axis will have a scale, denoted by periodic graduations and usually accompanied by numerical or categorical indications. Each axis will typically also have a label displayed outside or beside it, briefly describing the dimension represented. If the scale is numerical, the label will often be suffixed with the unit of that scale in parentheses. ...
Within the graph a grid of lines may appear to aid in the visual alignment of data. The grid can be enhanced by visually emphasizing the lines at regular or significant graduations. The emphasized lines are then called major grid lines and the remainder are minor grid lines.
The data of a chart can appear in all manner of formats, and may include individual textual labels describing the datum associated with the indicated position in the chart. The data may appear as dots or shapes, connected or unconnected, and in any combination of colors and patterns. Inferences or points of interest can be overlaid directly on the graph to further aid information extraction.
When the data appearing in a chart contains multiple variables, the chart may include a legend (also known as a key). A legend contains a list of the variables appearing in the chart and an example of their appearance. This information allows the data from each variable to be identified in the chart." [Chart. Wikipedia]
The vector stencils library "Time series charts" contains 10 templates: 3 column charts, 3 bar charts, 2 line graphs and 2 dot plots. All these charts are Live Objects displaying the data from external data source files.
Use these chart templates to design your business performance digital dashboards using the ConceptDraw PRO diagramming and vector drawing software.
The example "Design elements - Time series charts" is included in the Time Series Dashboard solution from the area "What is a Dashboard" of ConceptDraw Solution Park.
The vector stencils library "HR symbols" contains 45 HR pictograms.
Use this icon set with HR symbols to draw your HR flowcharts, workflow diagrams, process charts and infographics with the ConceptDraw PRO diagramming and vector drawing software.
The HR pictograms library "HR symbols" is included in the HR Flowcharts solution from the Management area of ConceptDraw Solution Park.
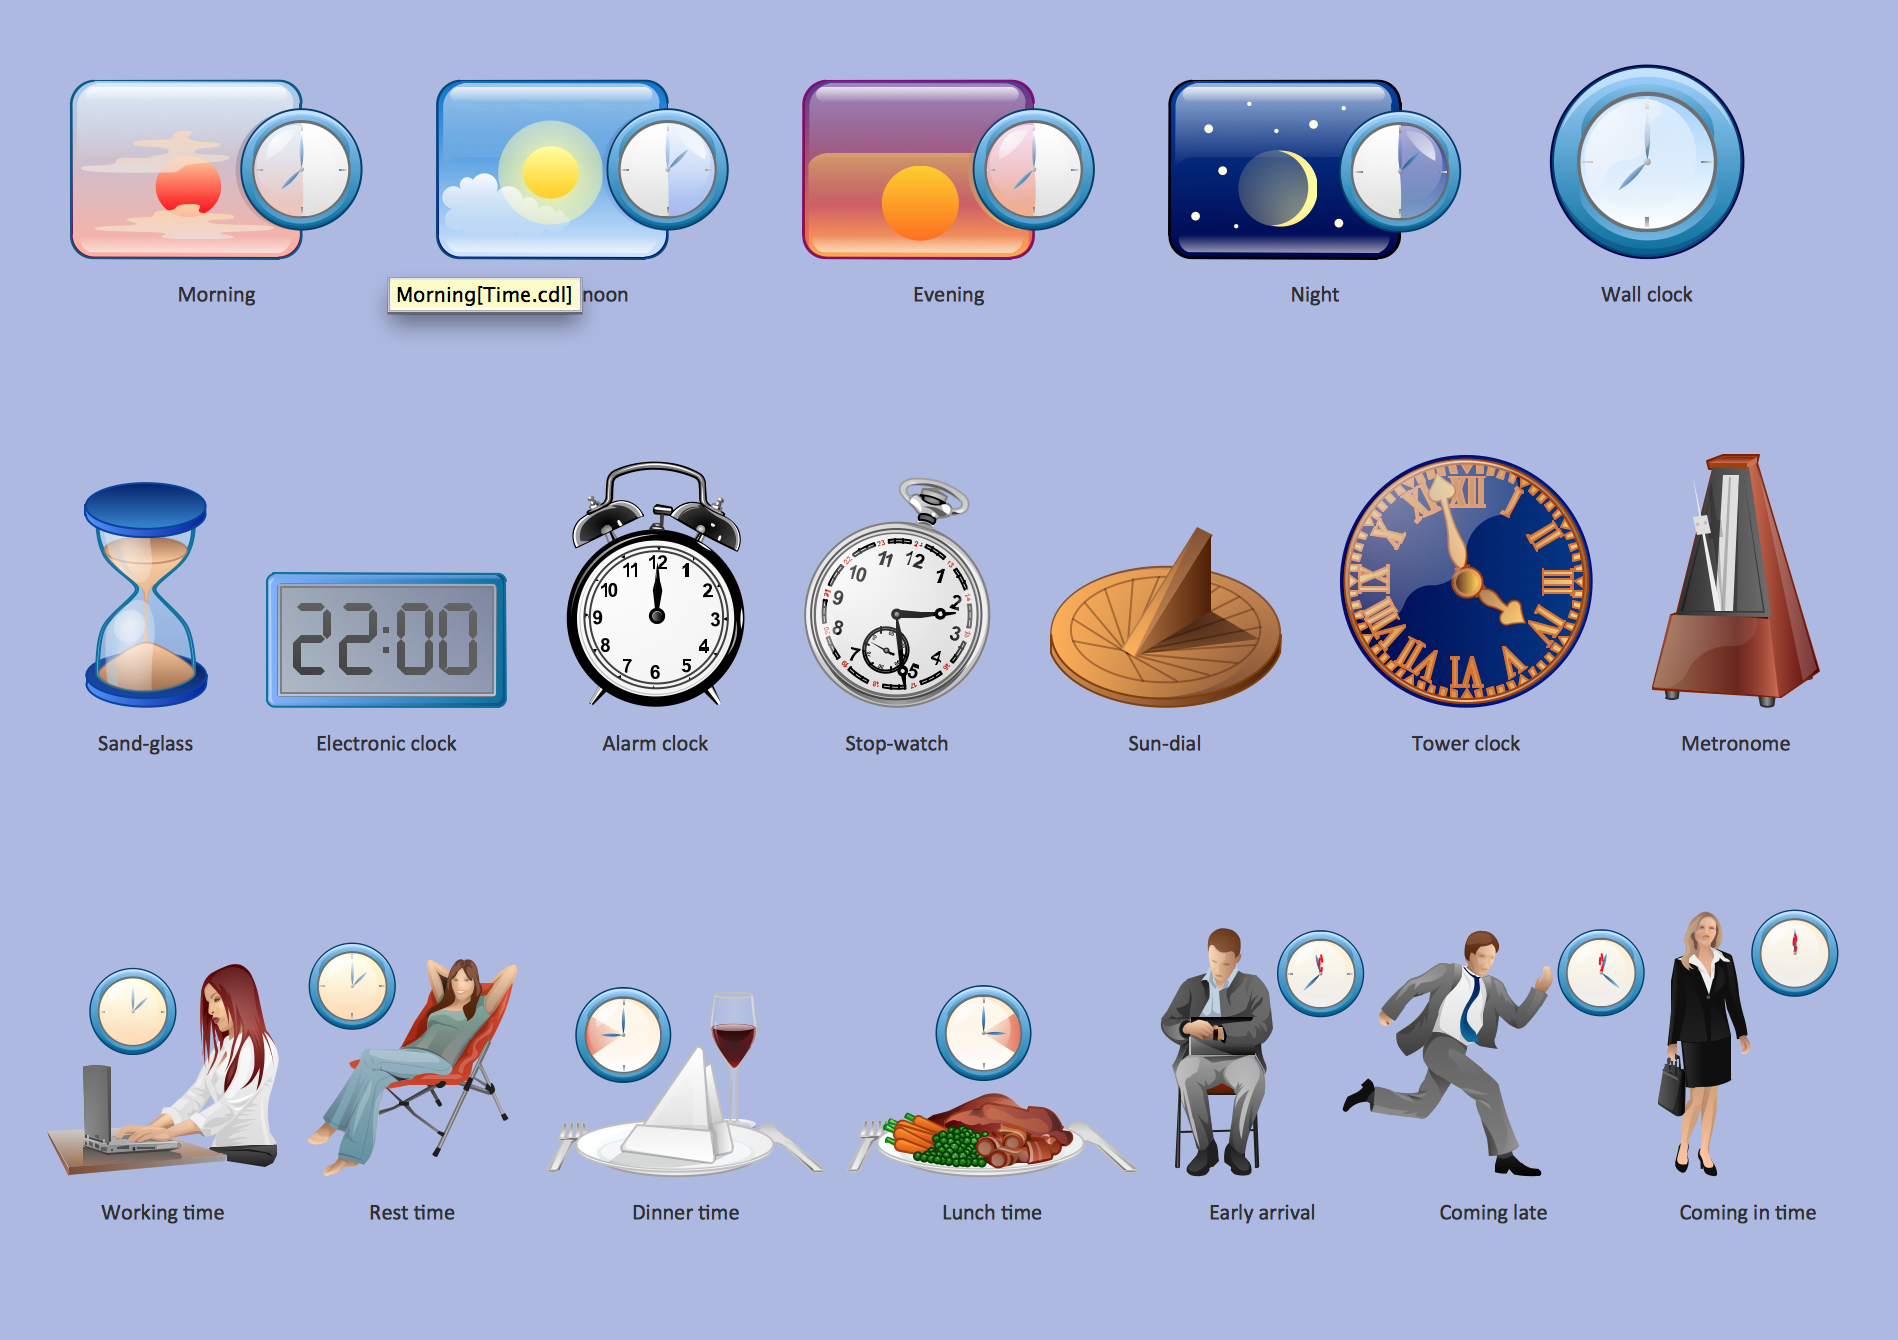
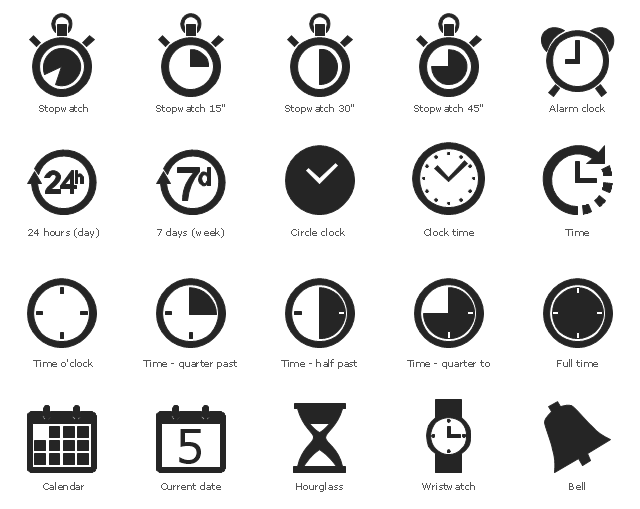
The vector stencils library "Time and clock pictograms" contains 20 time pictograms: clocks, calendars, day, week, bell, alarm clock, hourglass, wristwatch, and time intervals symbols.
Use it to create temporal infographic, illustrations and diagrams.
The pictograms example "Design elements - Time and clock pictograms" was created using the ConceptDraw PRO diagramming and vector drawing software extended with the Pictorial Infographic solution from the area "What is infographics" in ConceptDraw Solution Park.
Basketball Field in the Vector
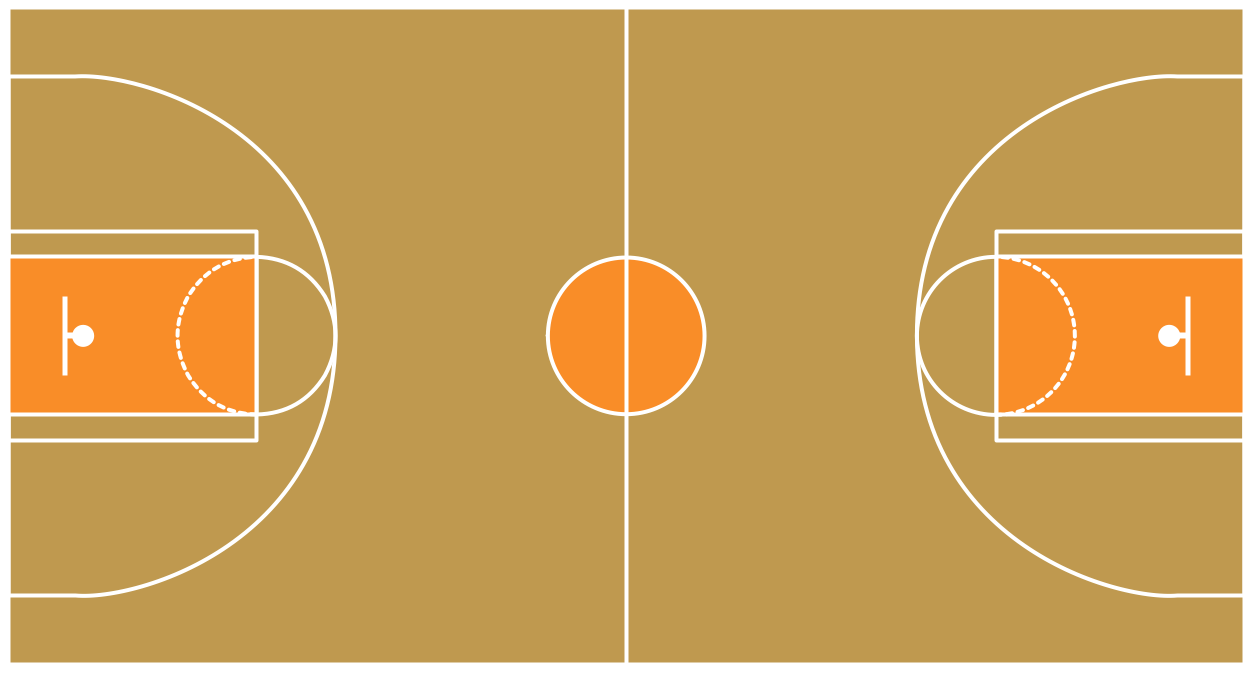
The Basketball Field library from the Basketball solution provides a complete set of ready-to-use predesigned vector courts: horizontally and vertically located, whole and half of court, colored and not, courts with views from different sides. All courts objects are designed according to the real basketball courts dimensions. Simply drop the needed basketball field in the vector from the library to design your own basketball diagram.The vector stencils library "Time" contains 20 time and clock icons.
Use it to design your business and finance illustrations and infographics with ConceptDraw PRO diagramming and vector drawing software.
"Time management is the act or process of planning and exercising conscious control over the amount of time spent on specific activities, especially to increase effectiveness, efficiency or productivity.
It is a meta-activity with the goal to maximize the overall benefit of a set of other activities within the boundary condition of a limited amount of time.
Time management may be aided by a range of skills, tools, and techniques used to manage time when accomplishing specific tasks, projects, and goals complying with a due date." [Time management. Wikipedia]
The icon set example "Design elements - Time" is included in the Business and Finance solution from Illustration area of ConceptDraw Solution Park.
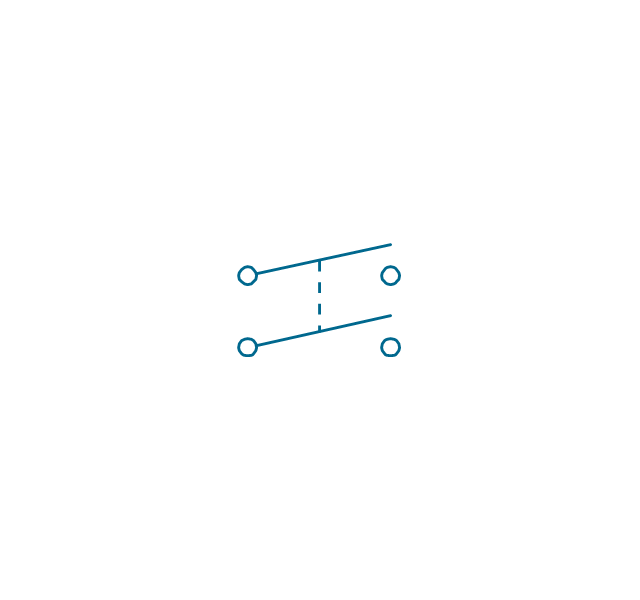
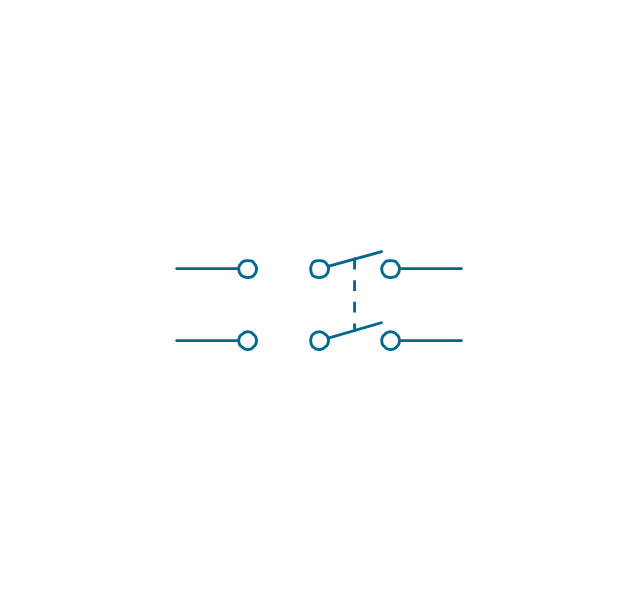
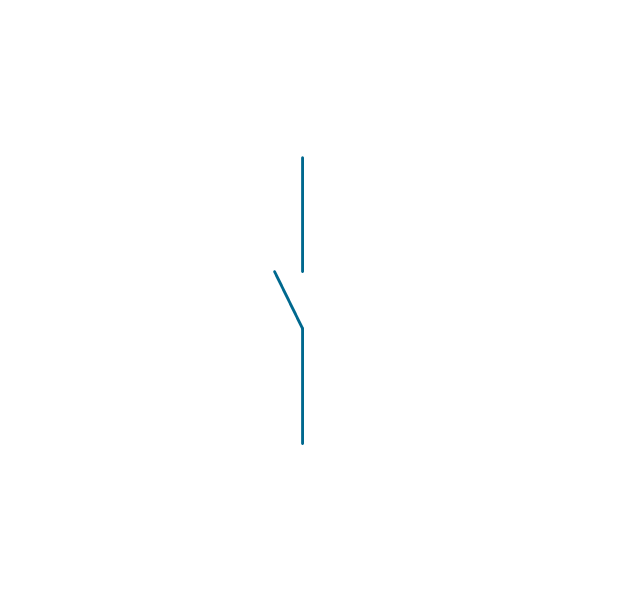
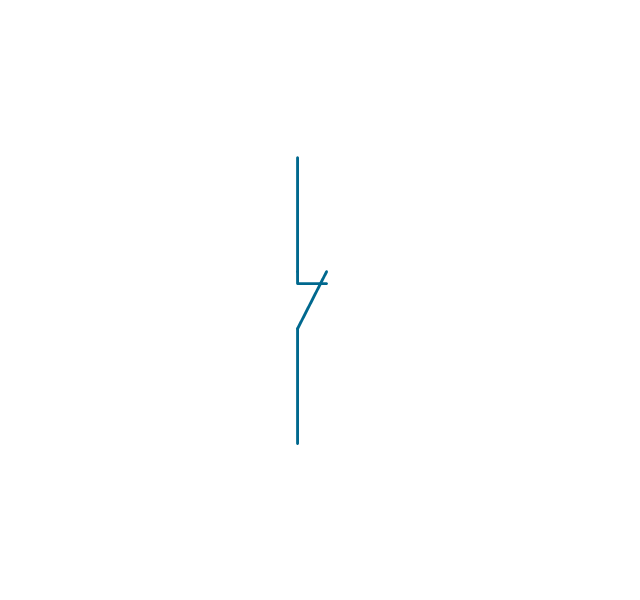
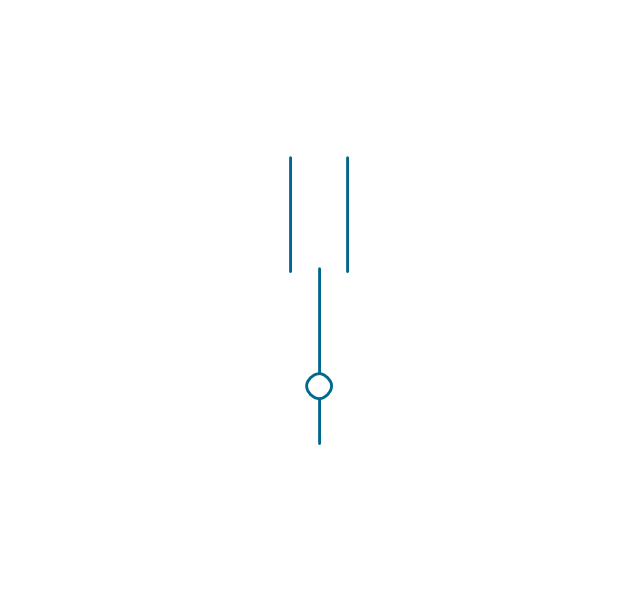
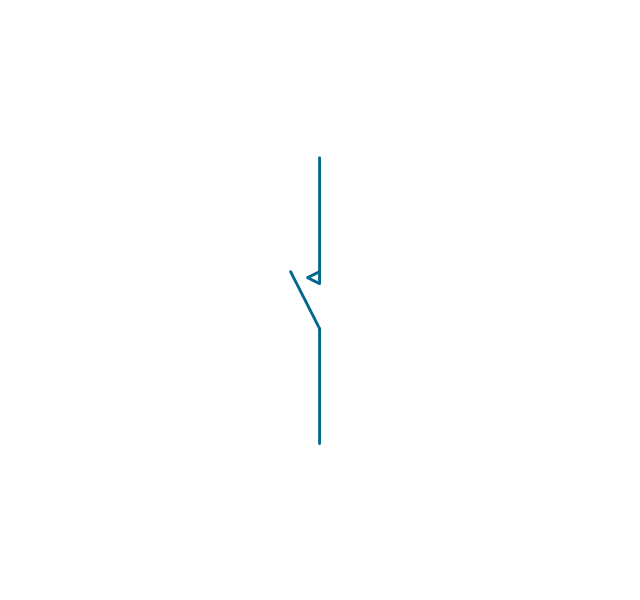
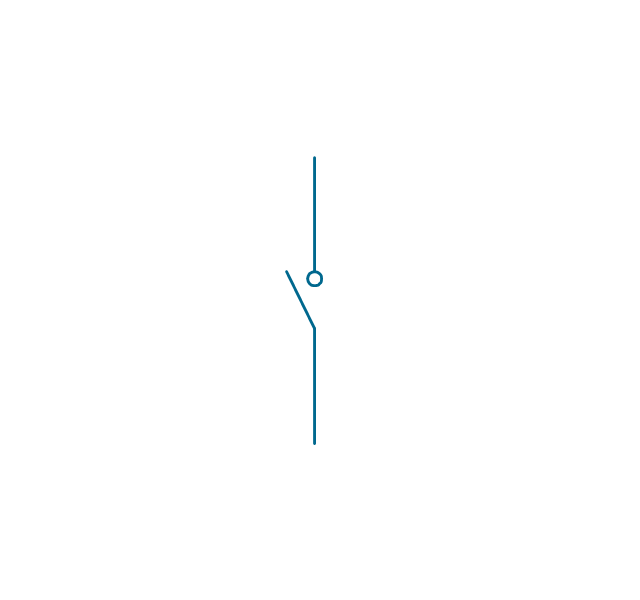
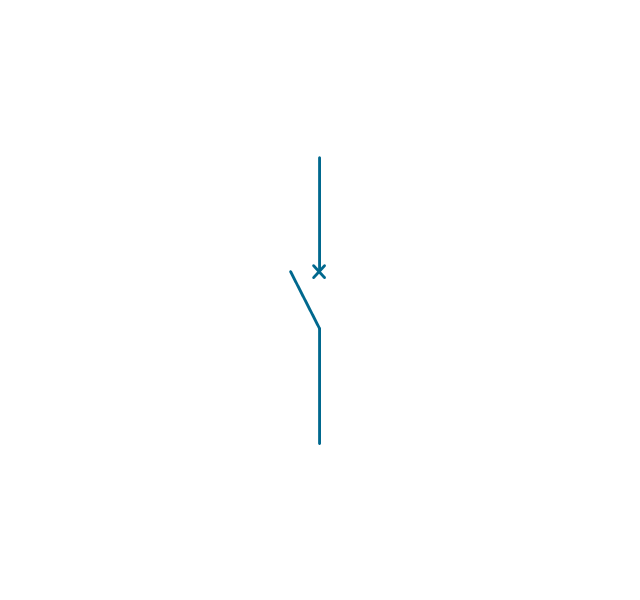
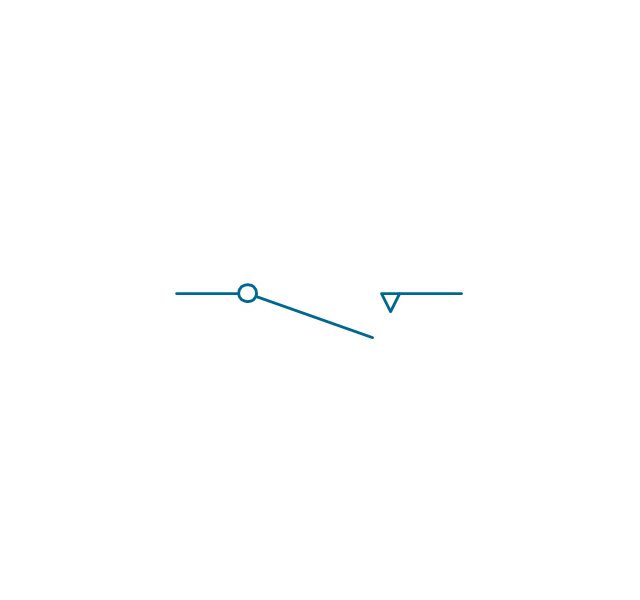
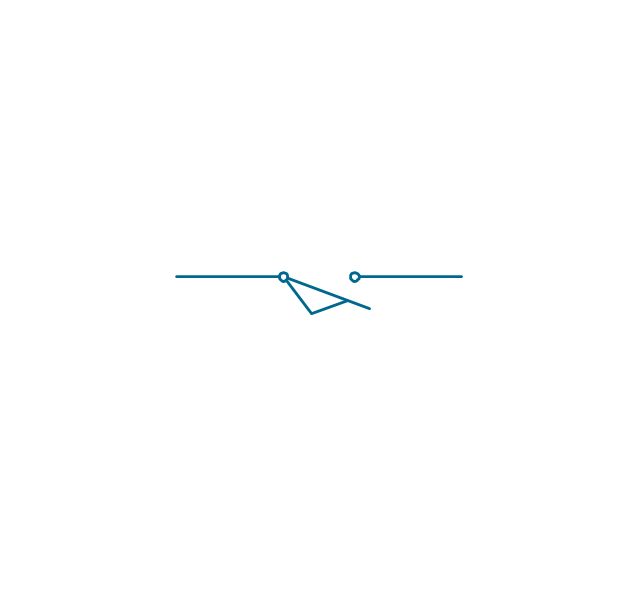
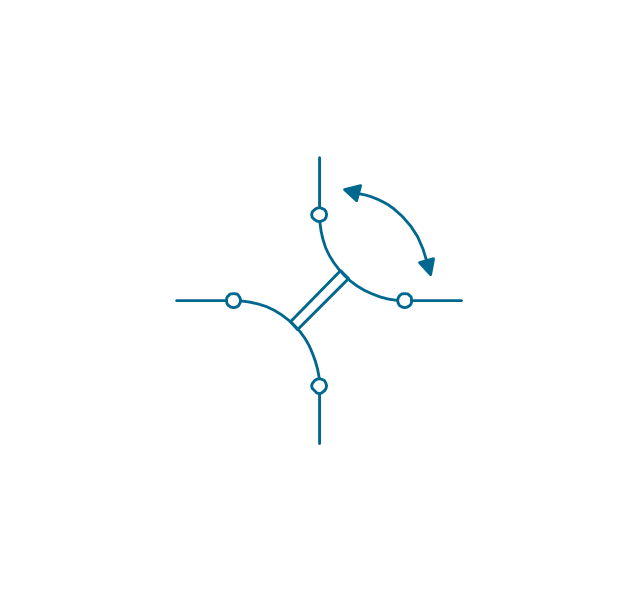
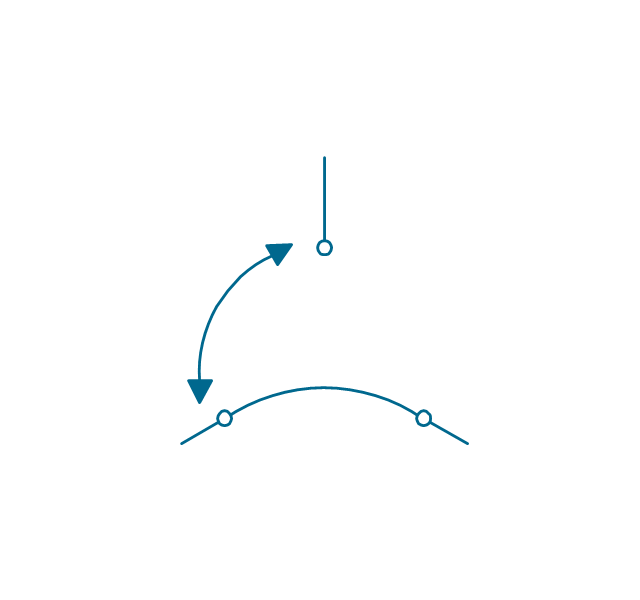
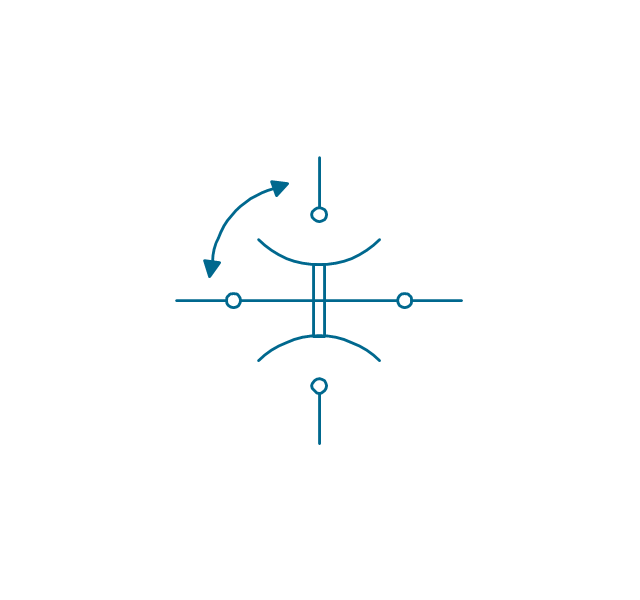
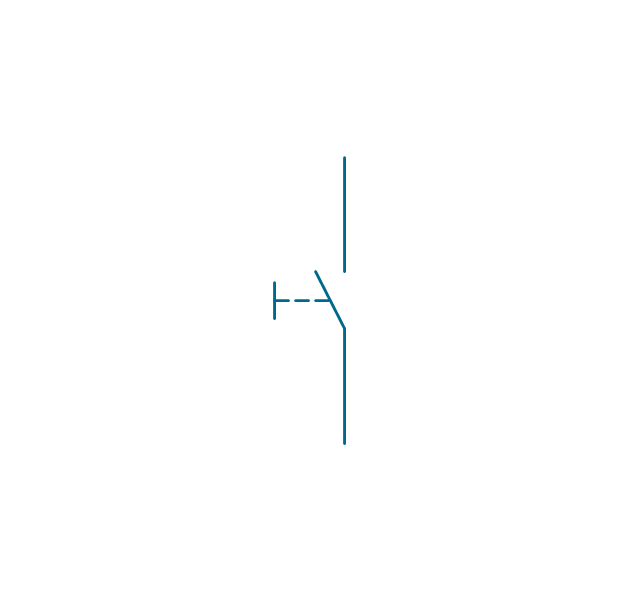
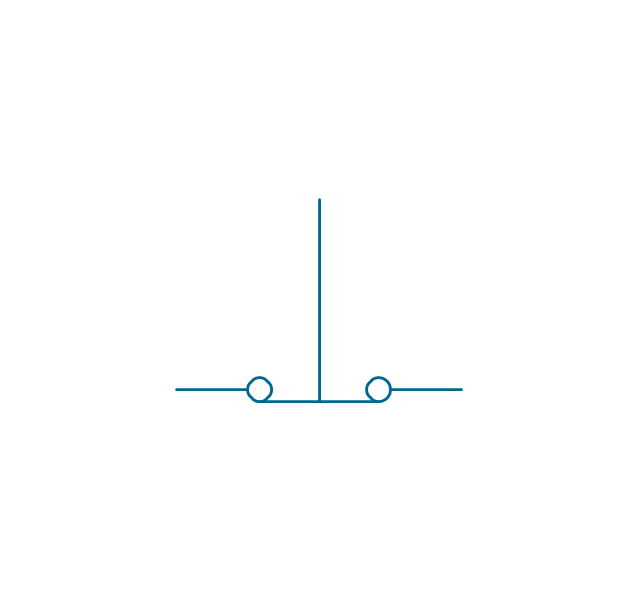
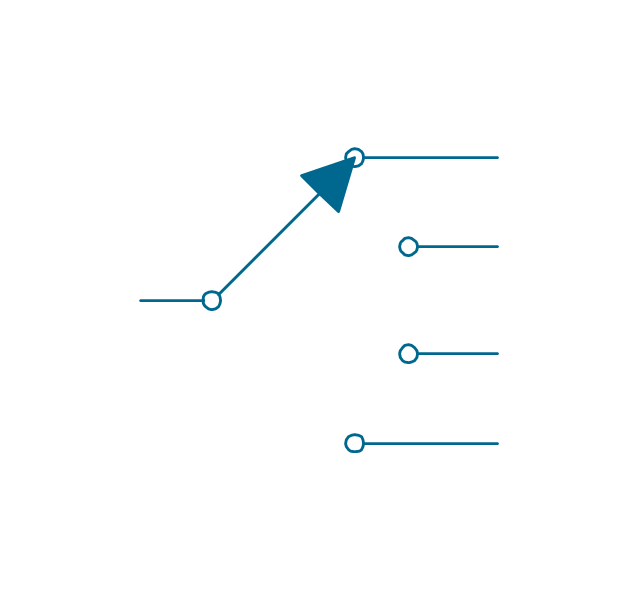
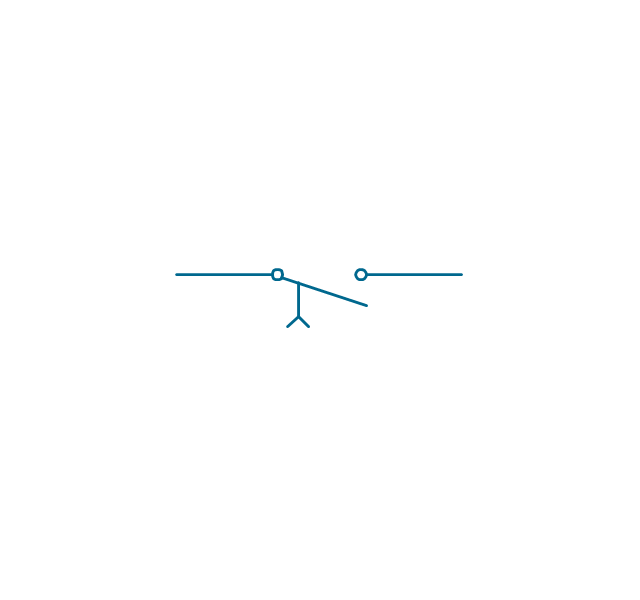
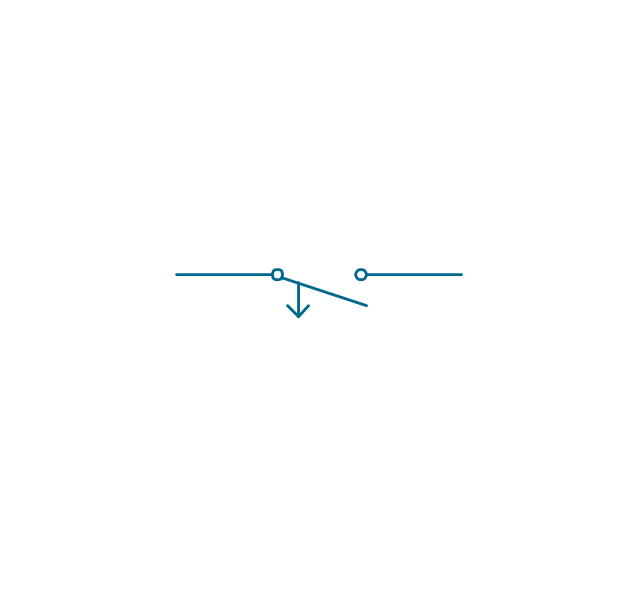
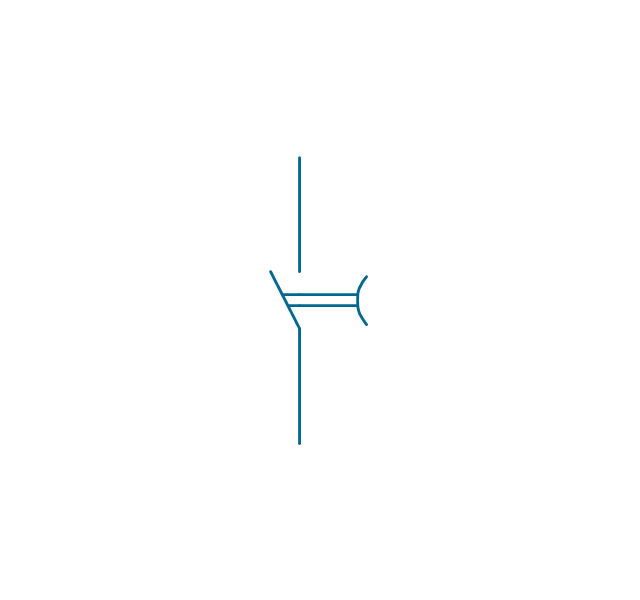
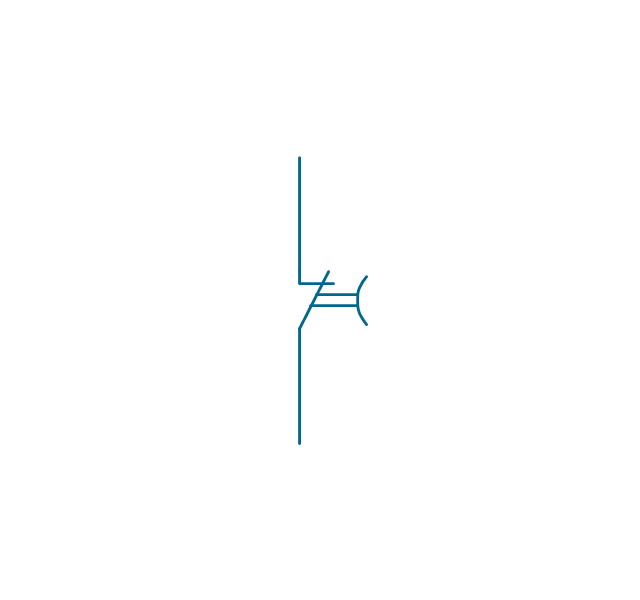
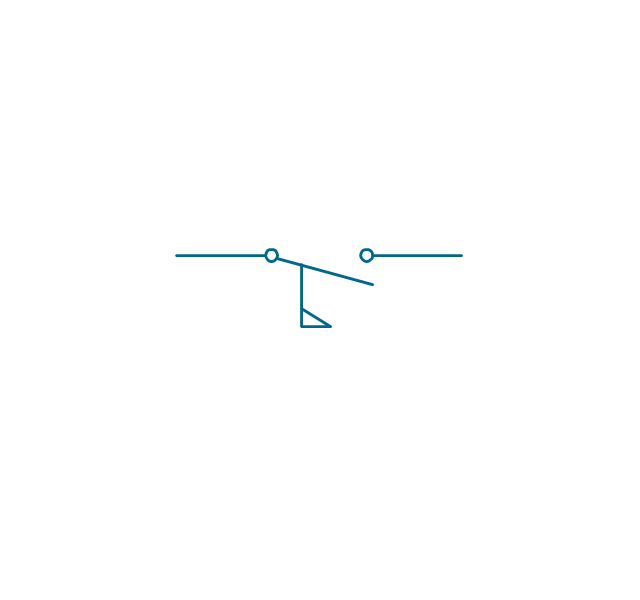
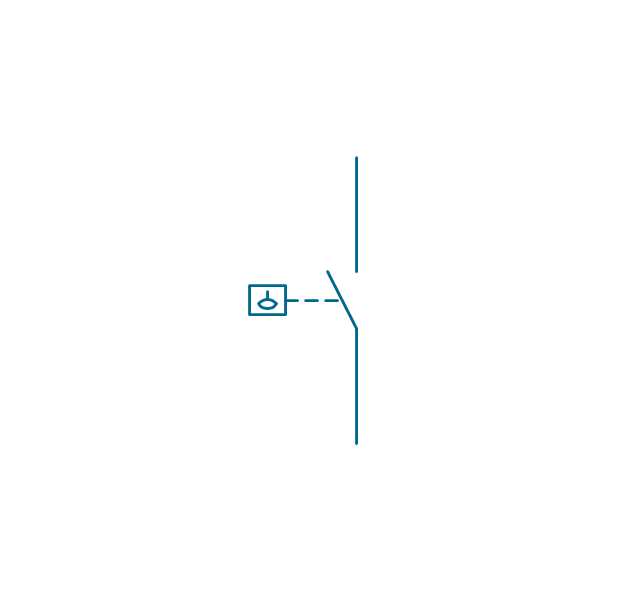
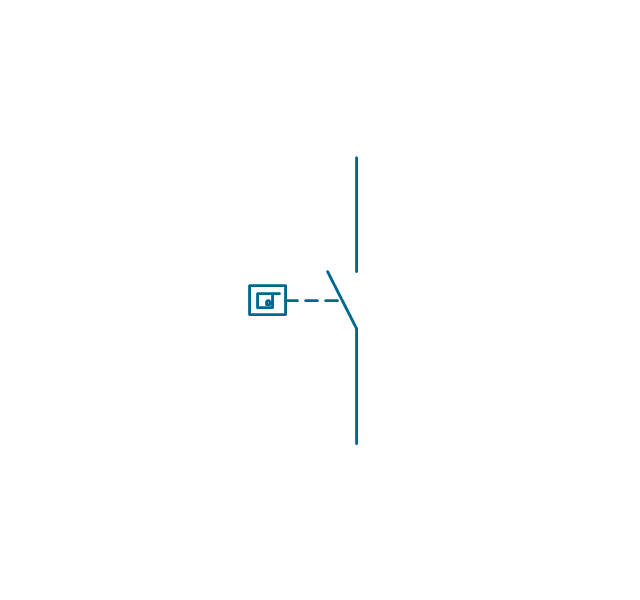
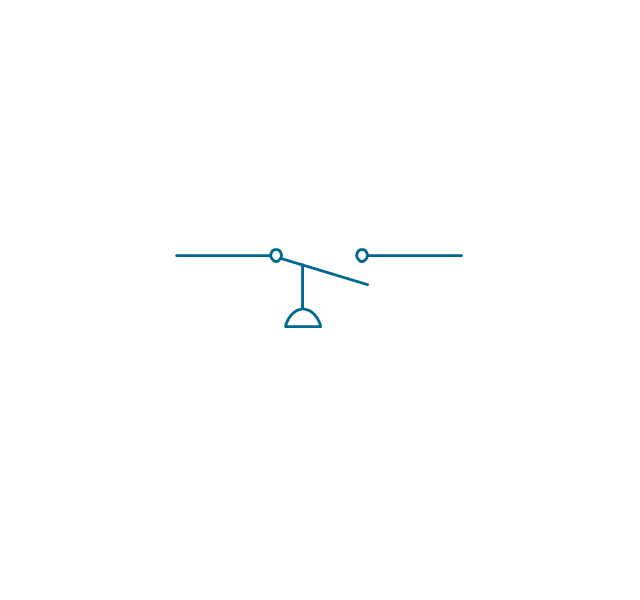
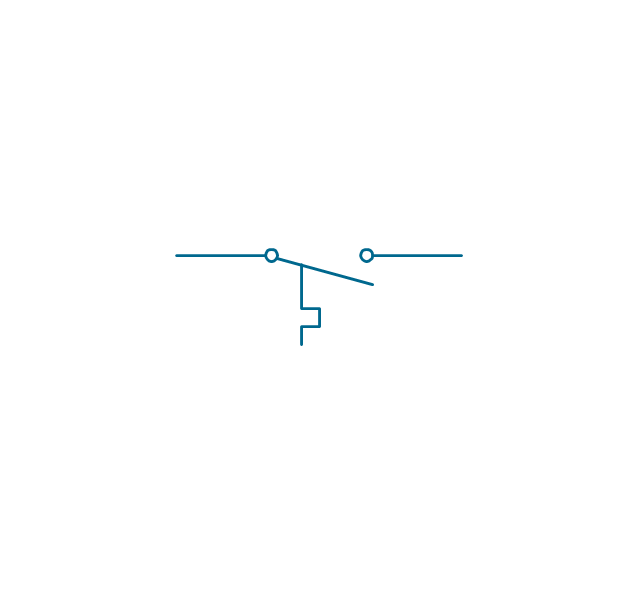
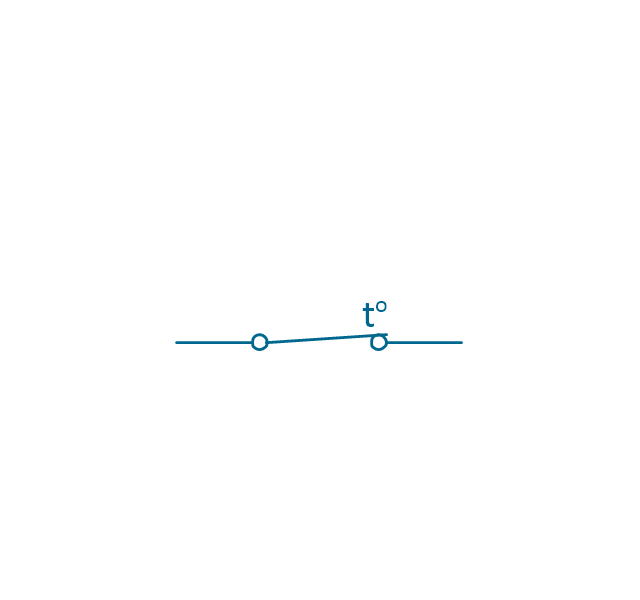
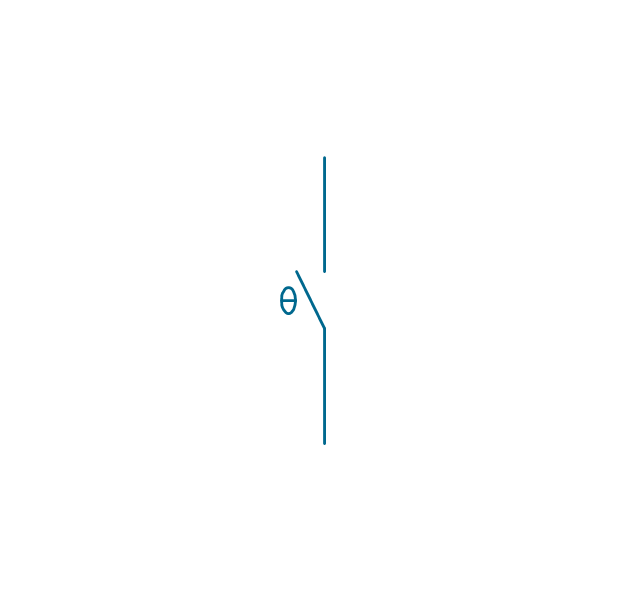
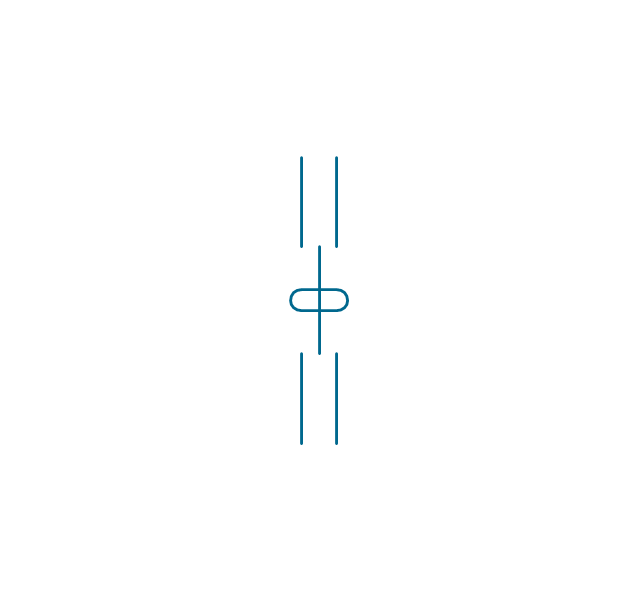
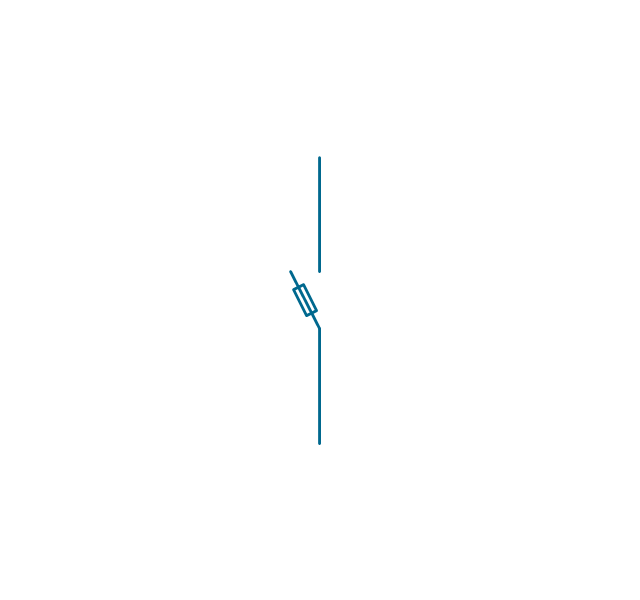
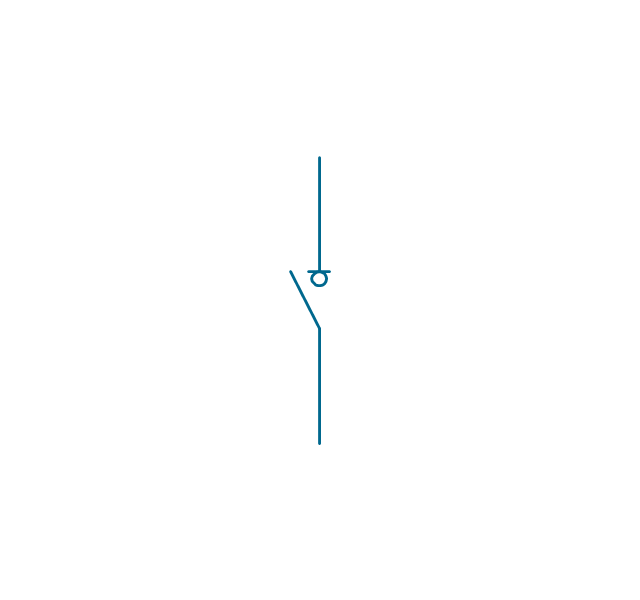
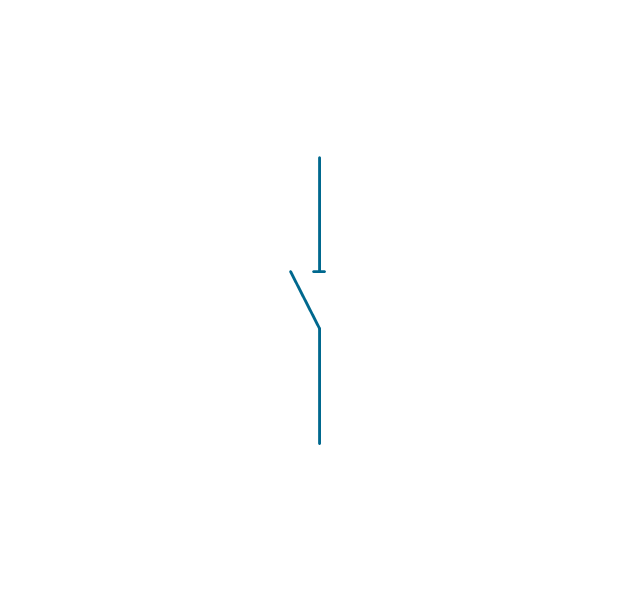
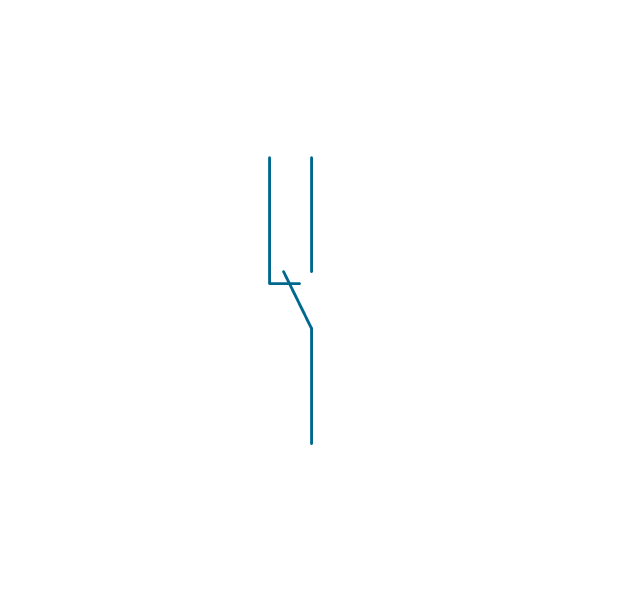
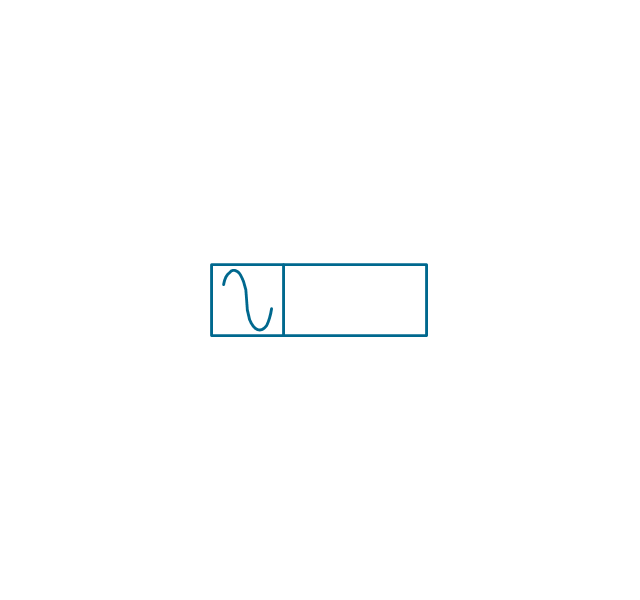
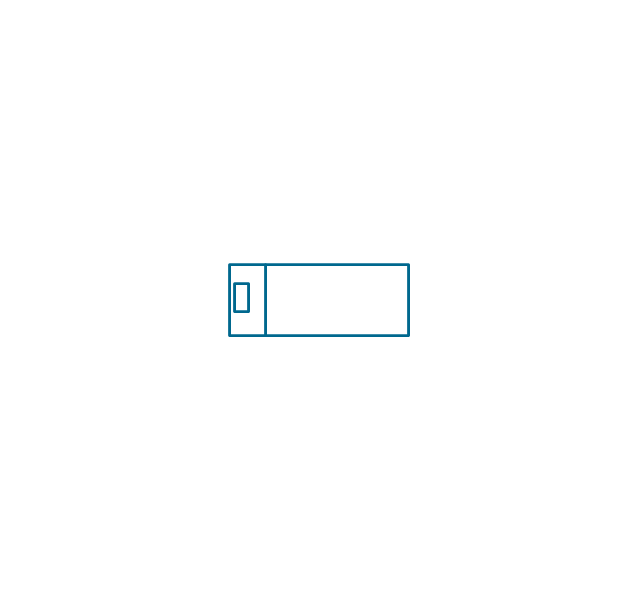
The vector stencils library "Switches and relays" contains 58 symbols of electrical contacts, switches, relays, circuit breakers, selectors, connectors, disconnect devices, switching circuits, current regulators, and thermostats for electrical devices.
Use these shapes for drawing electrical diagrams in the ConceptDraw PRO diagramming and vector drawing software extended with the Electrical Engineering solution from the Engineering area of ConceptDraw Solution Park.
www.conceptdraw.com/ solution-park/ engineering-electrical
Use these shapes for drawing electrical diagrams in the ConceptDraw PRO diagramming and vector drawing software extended with the Electrical Engineering solution from the Engineering area of ConceptDraw Solution Park.
www.conceptdraw.com/ solution-park/ engineering-electrical
The vector stencils library "HR workflow" contains 60 HR workflow symbols.
Use this HR icon set to draw your HR flowcharts, workflow diagrams and process charts with the ConceptDraw PRO diagramming and vector drawing software.
The HR pictograms library "HR workflow" is included in the HR Flowcharts solution from the Management area of ConceptDraw Solution Park.
Use this HR icon set to draw your HR flowcharts, workflow diagrams and process charts with the ConceptDraw PRO diagramming and vector drawing software.
The HR pictograms library "HR workflow" is included in the HR Flowcharts solution from the Management area of ConceptDraw Solution Park.
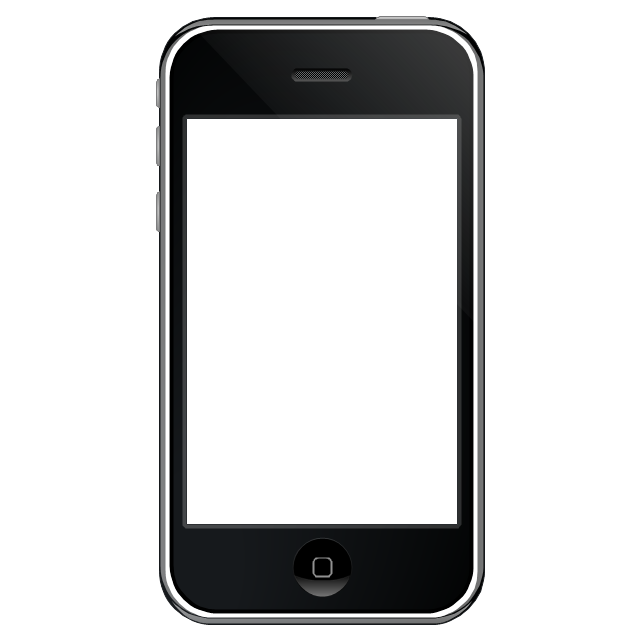
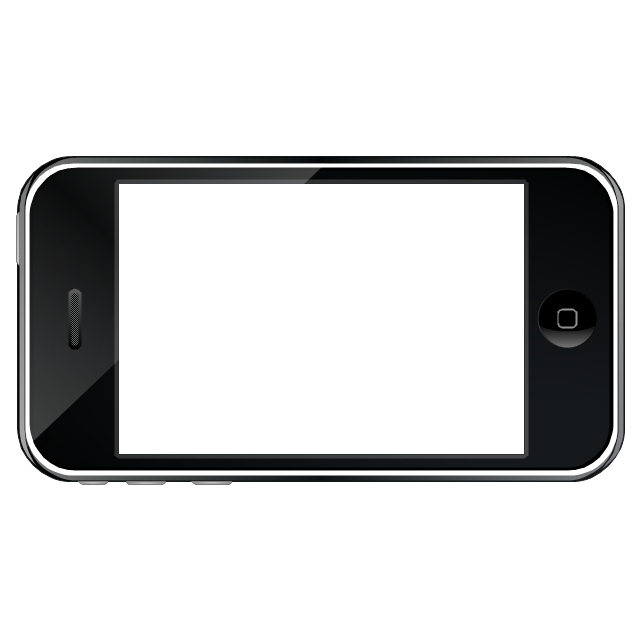
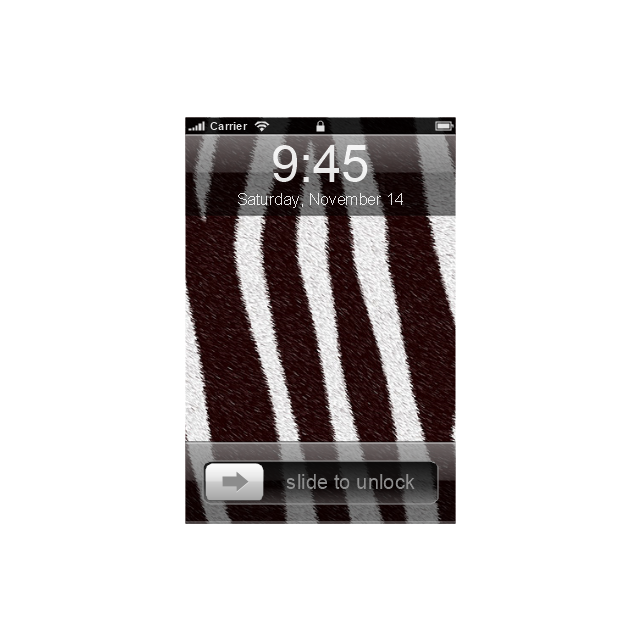
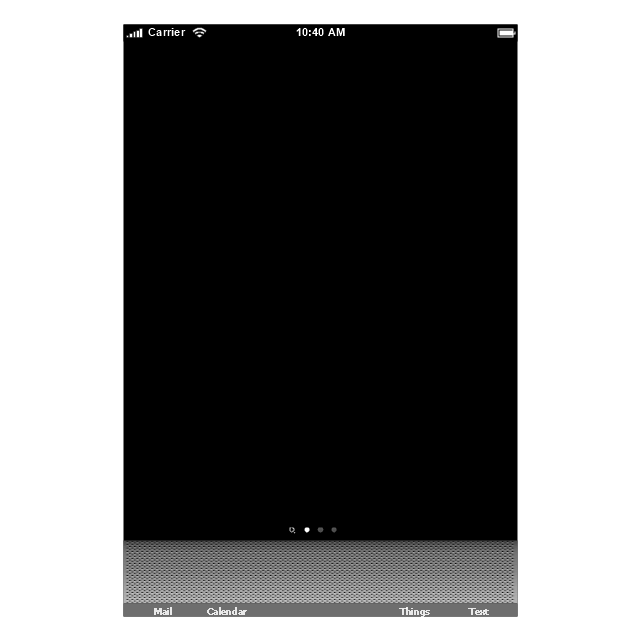
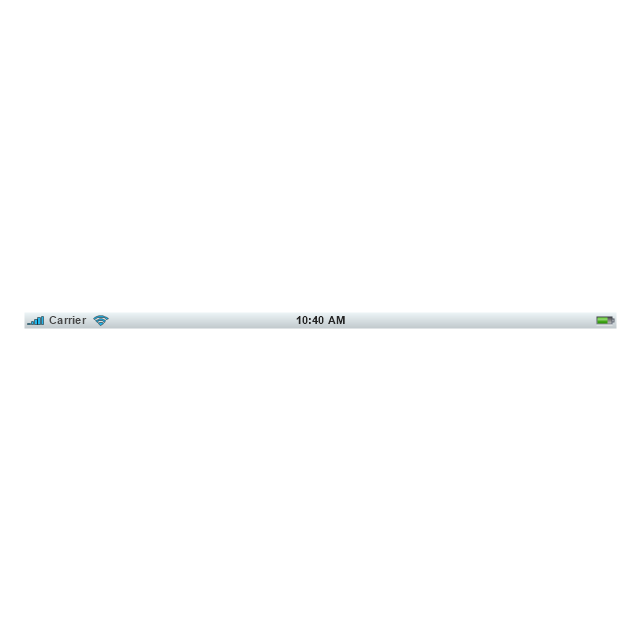
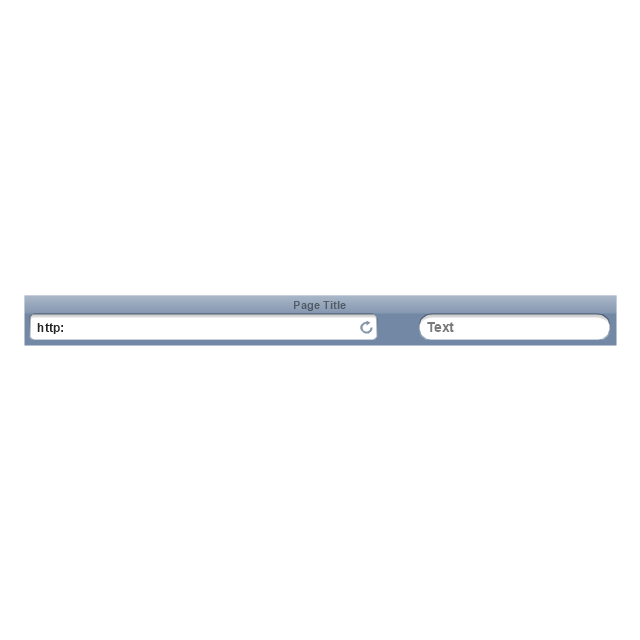
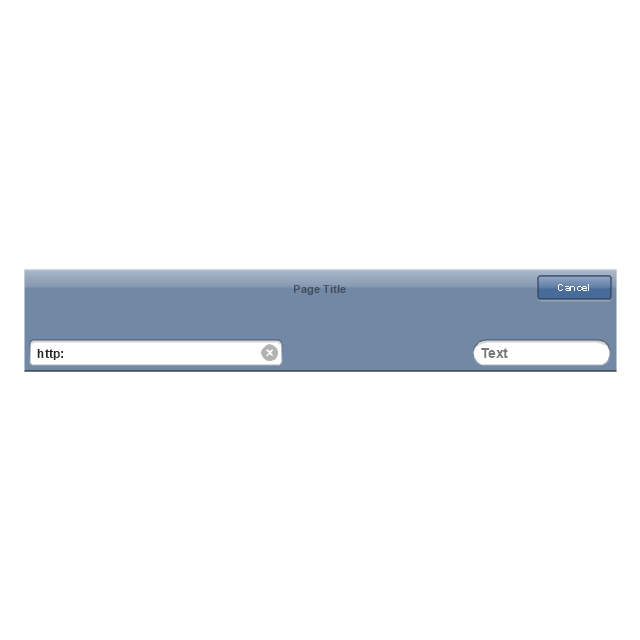
The vector stencils library "iPhone interface" contains 119 iPhone UI design elements.
Use it for development of graphic user interface (GUI) for iPhone software applications in the ConceptDraw PRO diagramming and vector drawing software extended with the Graphic User Interface solution from the Software Development area of ConceptDraw Solution Park.
Use it for development of graphic user interface (GUI) for iPhone software applications in the ConceptDraw PRO diagramming and vector drawing software extended with the Graphic User Interface solution from the Software Development area of ConceptDraw Solution Park.
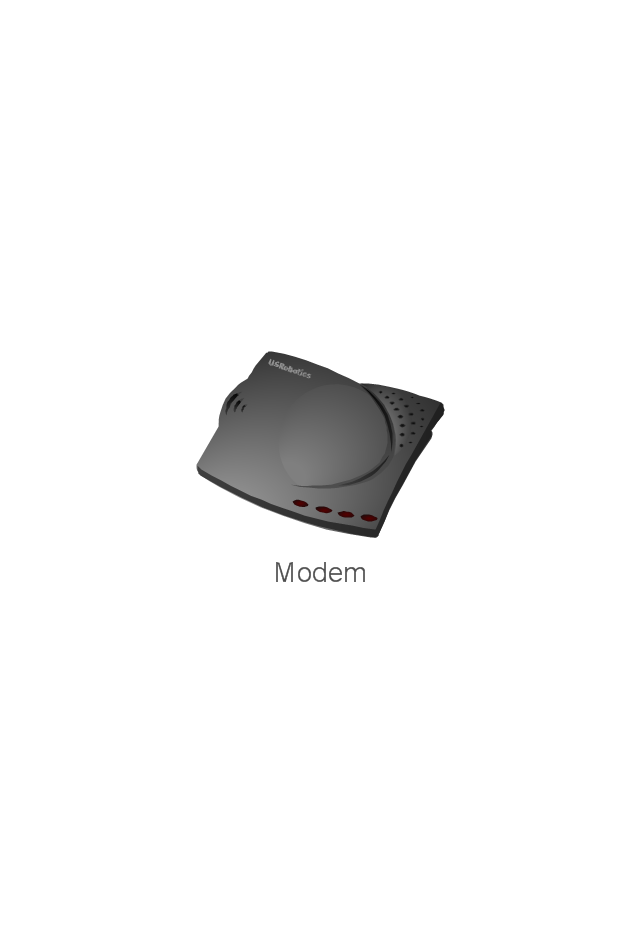
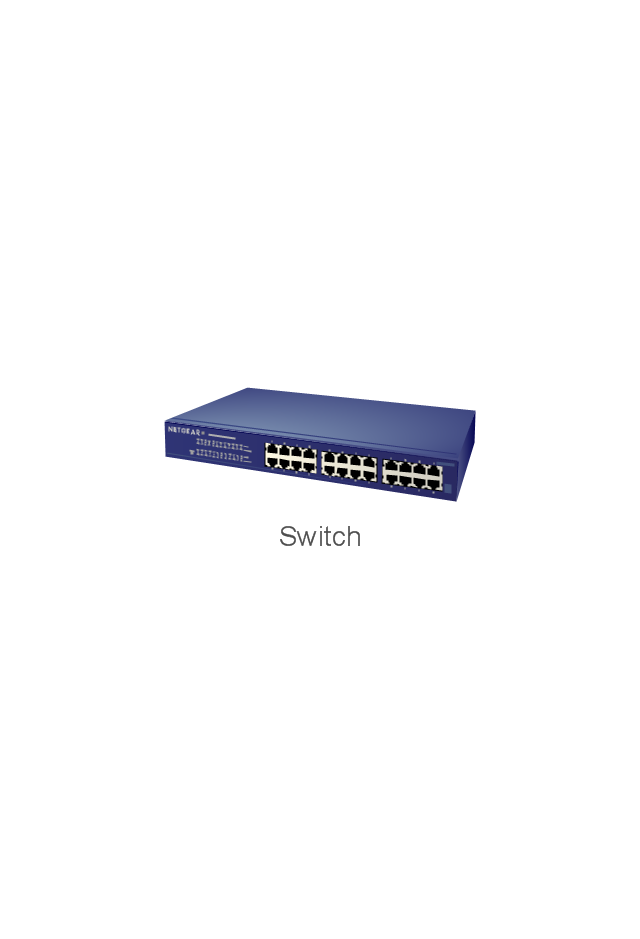
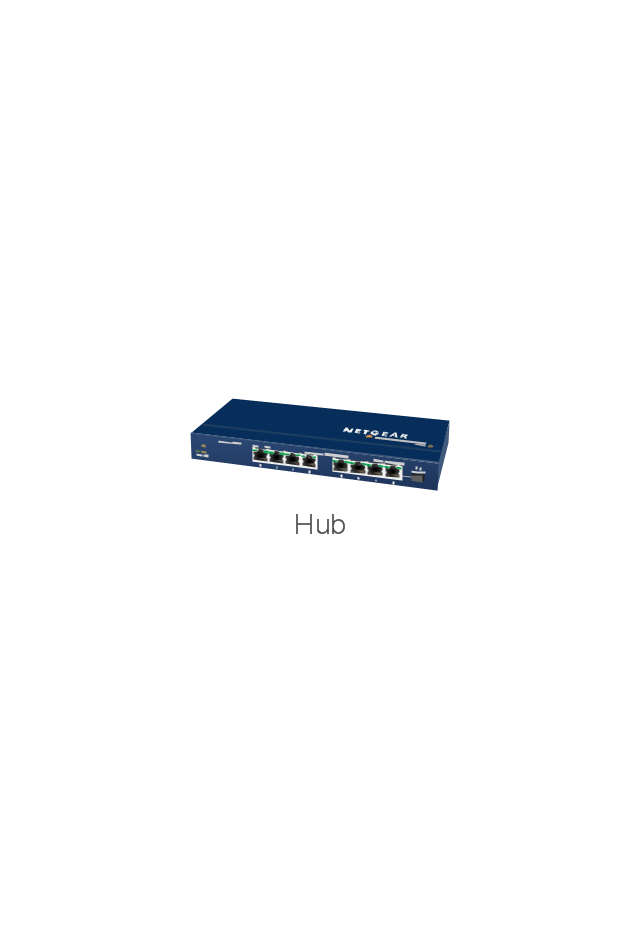
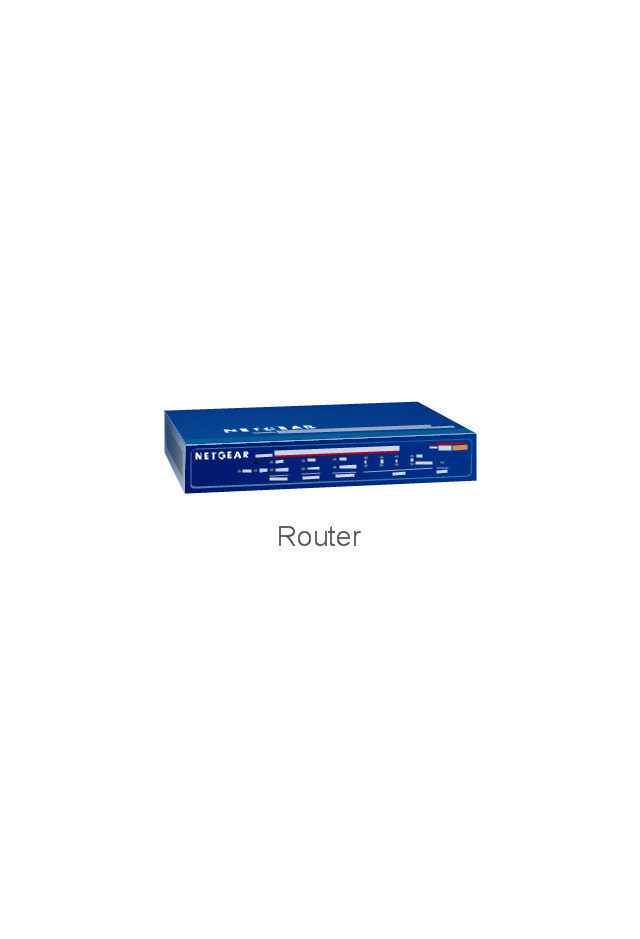
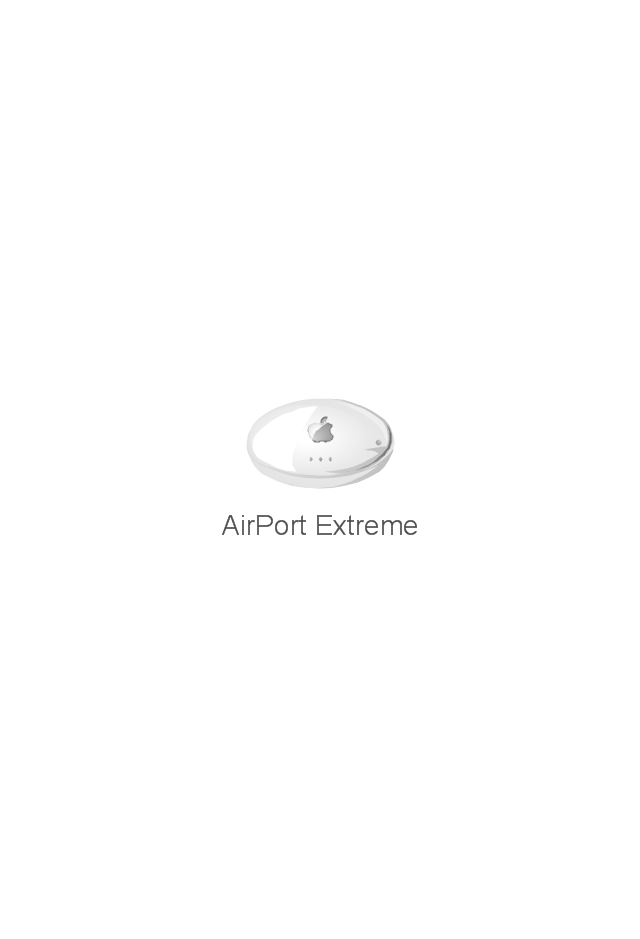
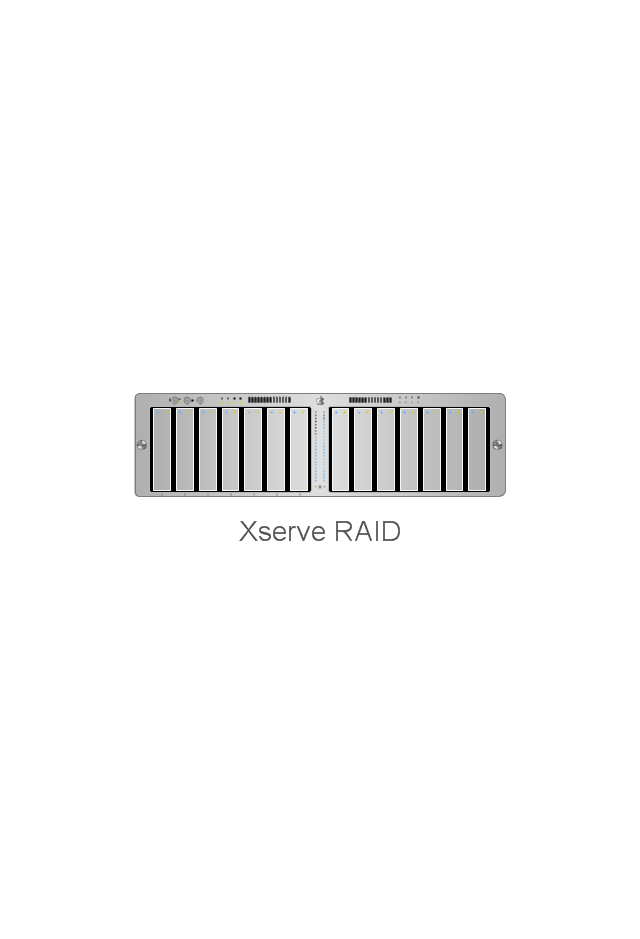
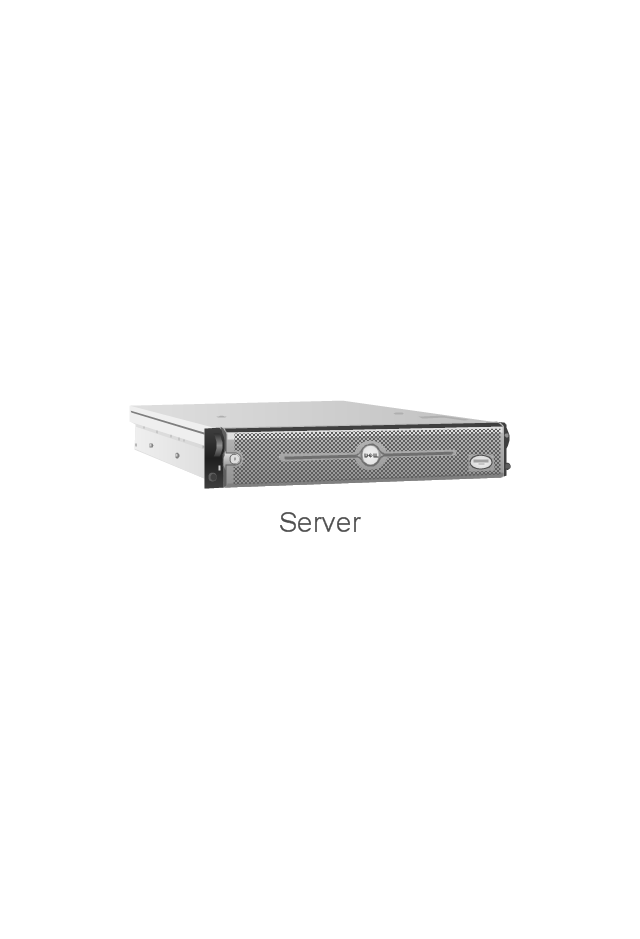
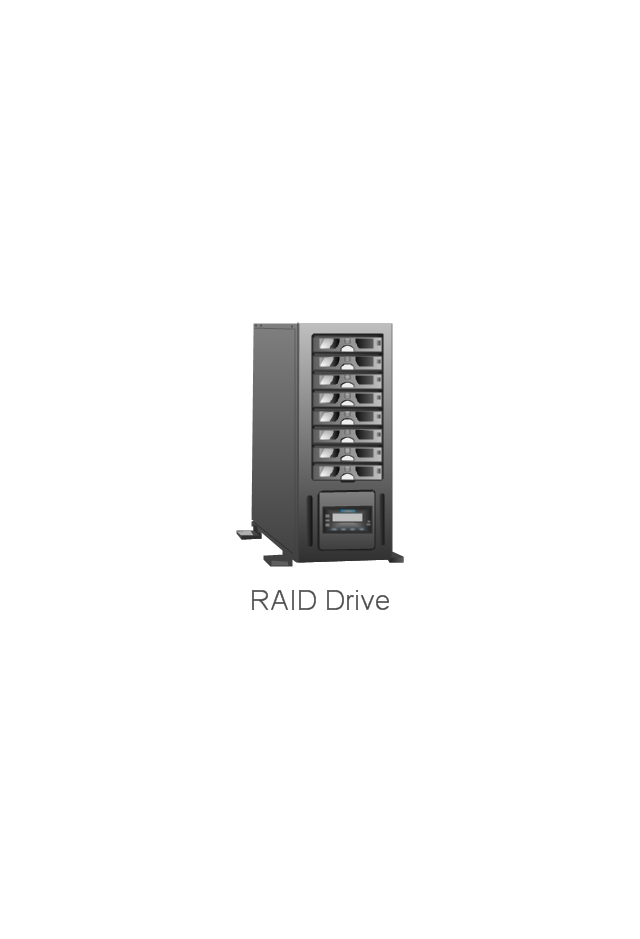
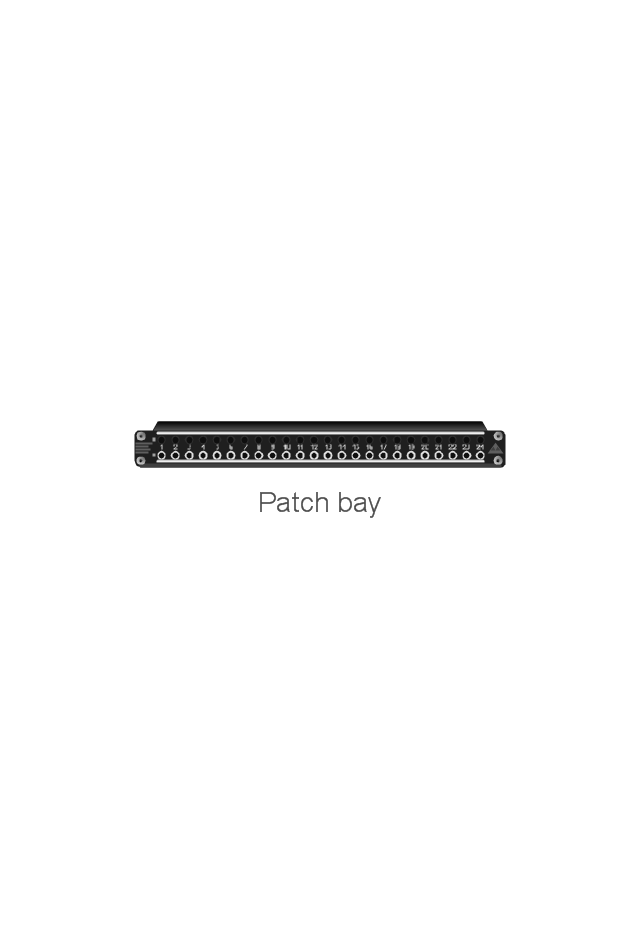
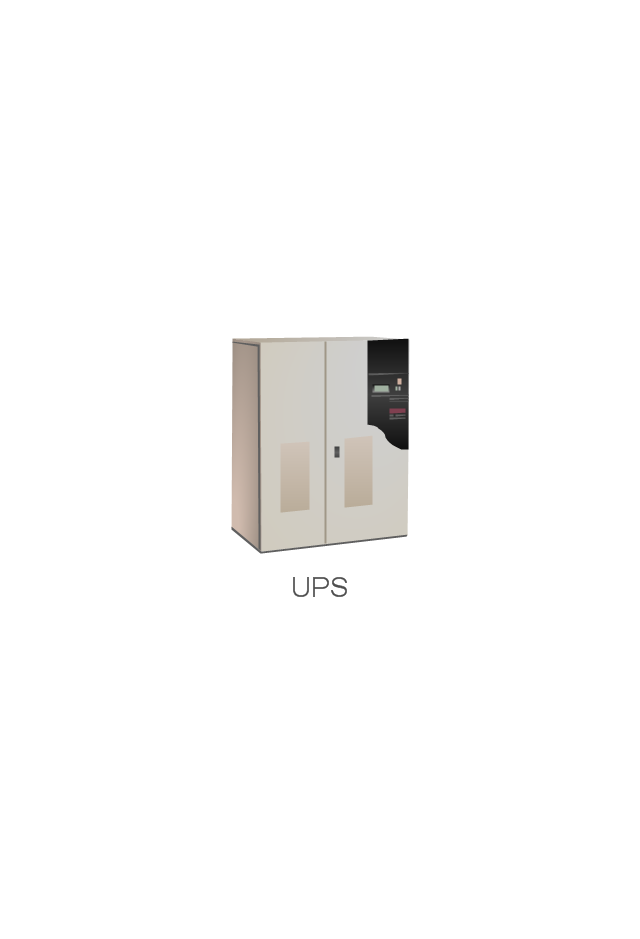
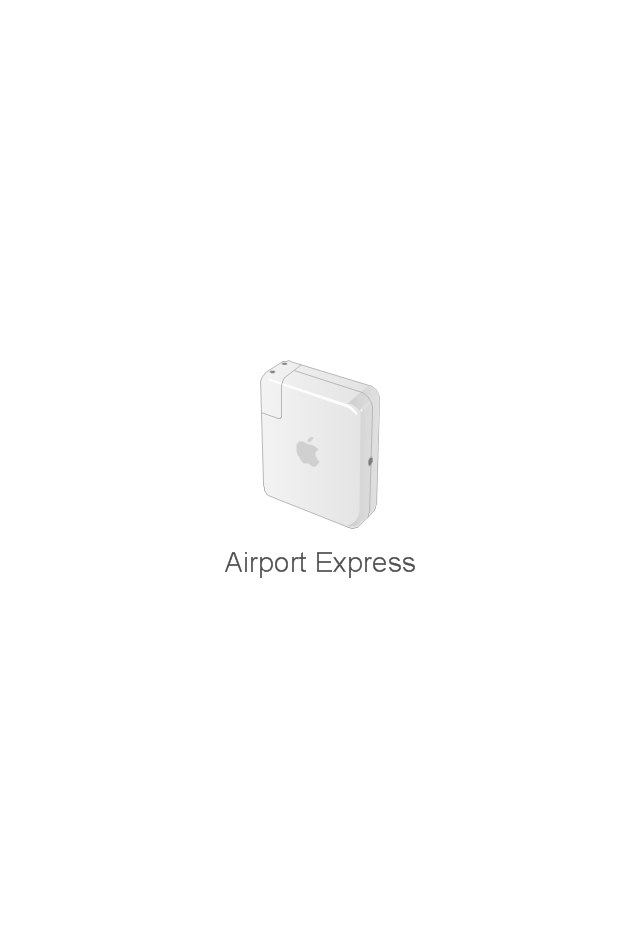
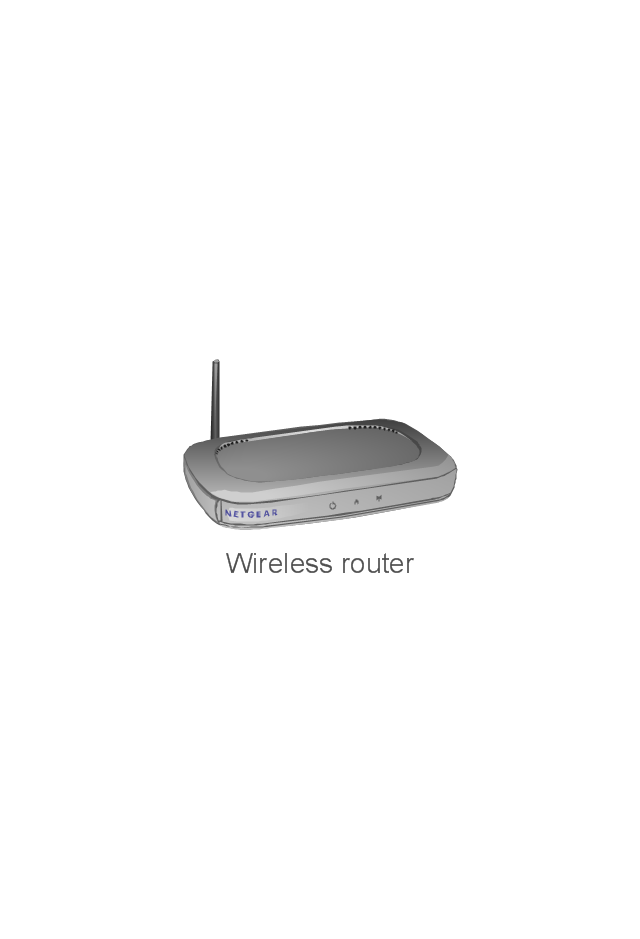
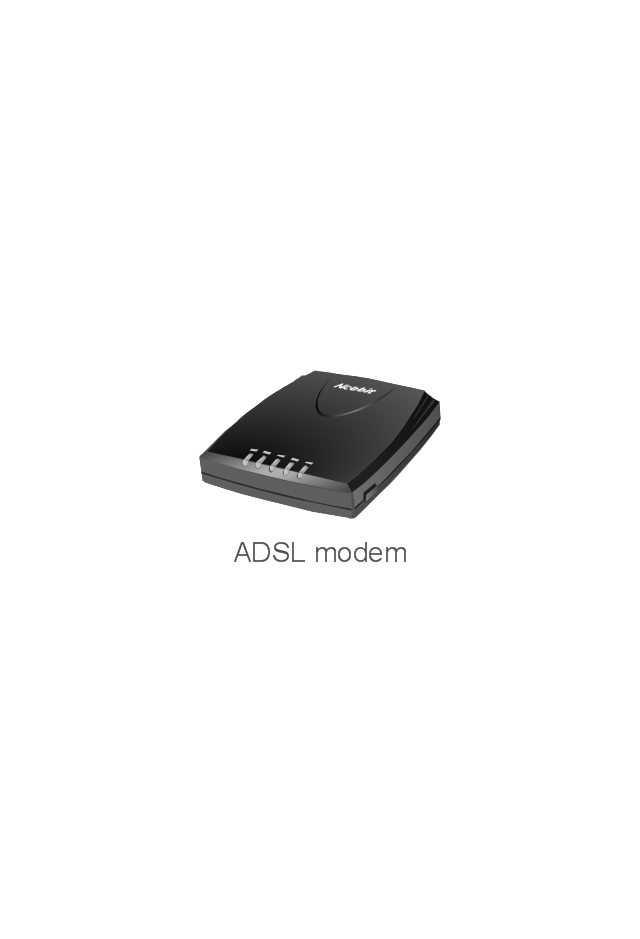
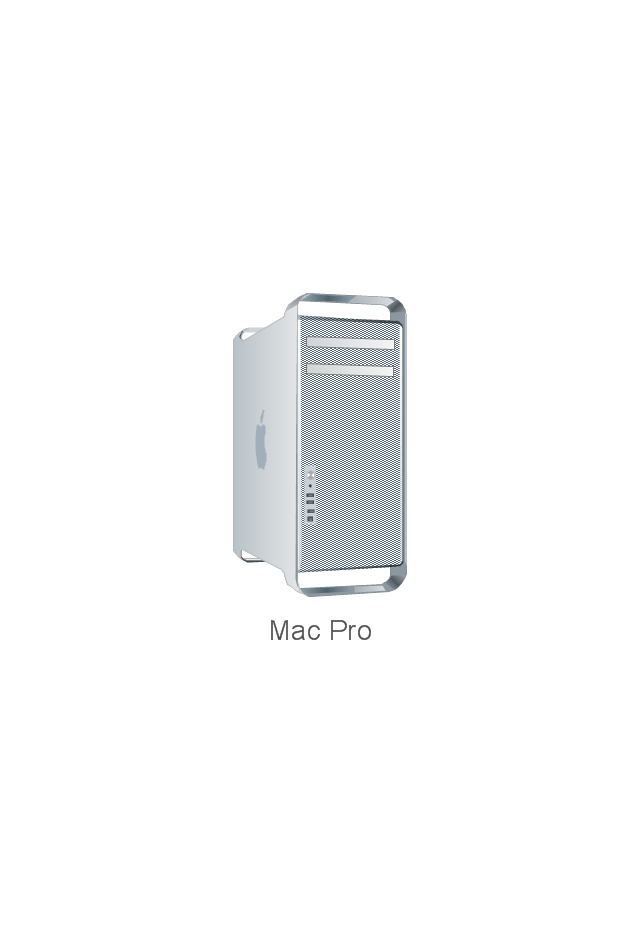
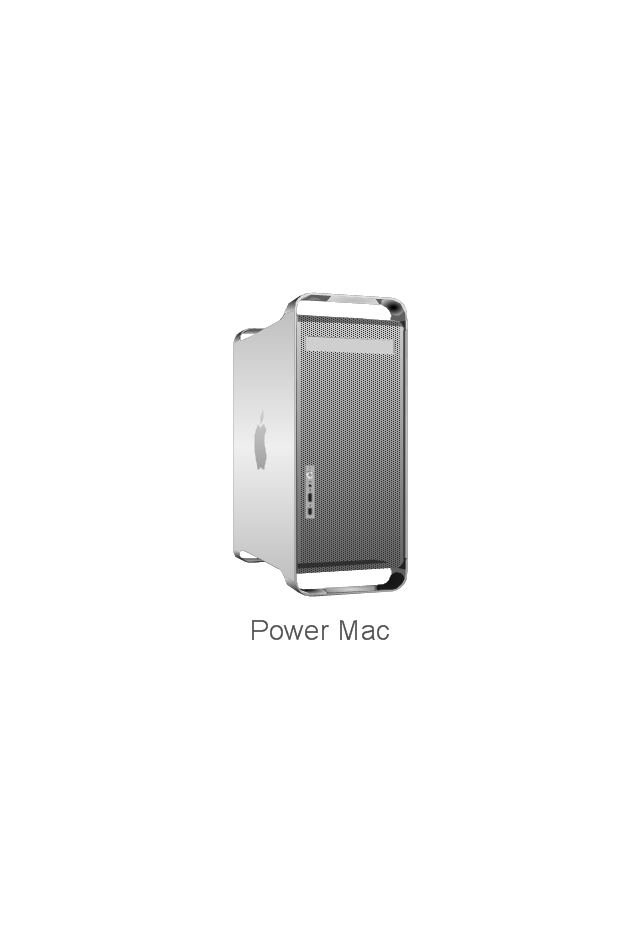
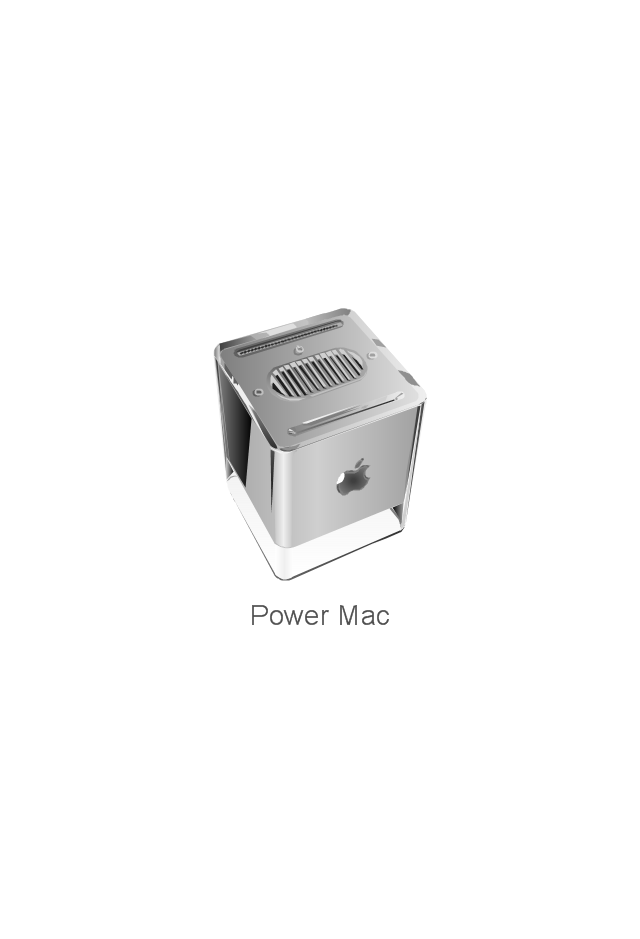
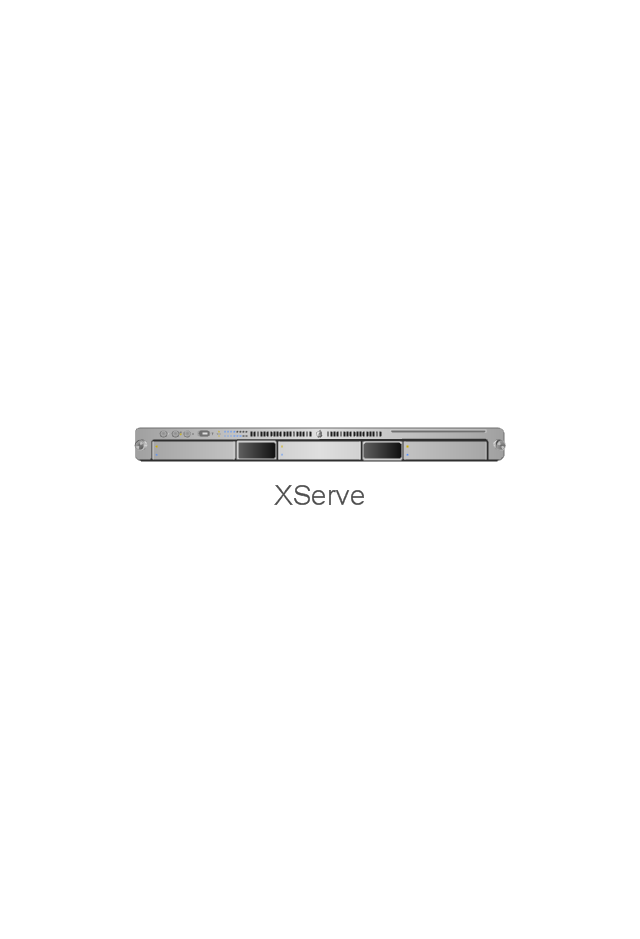
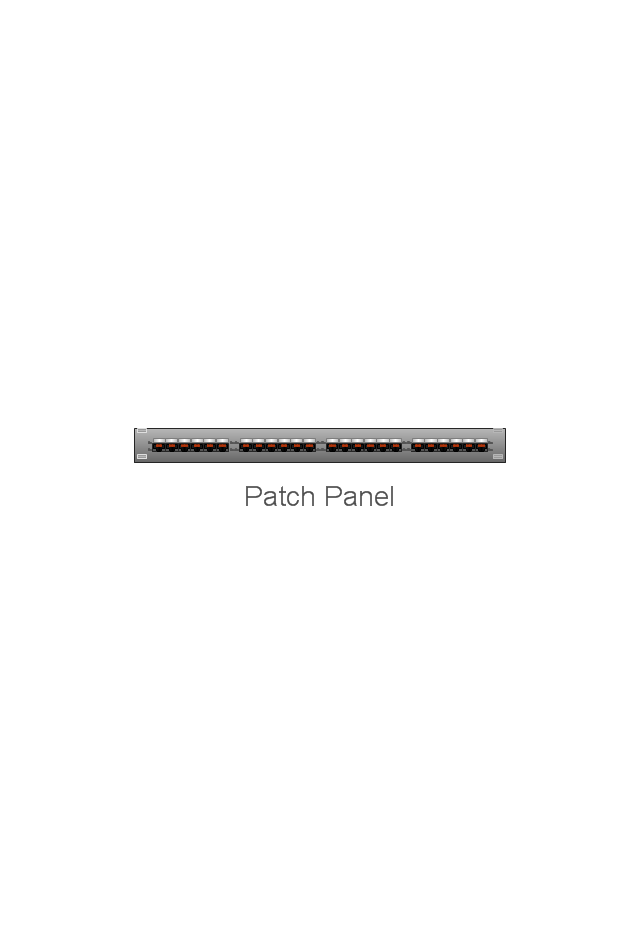
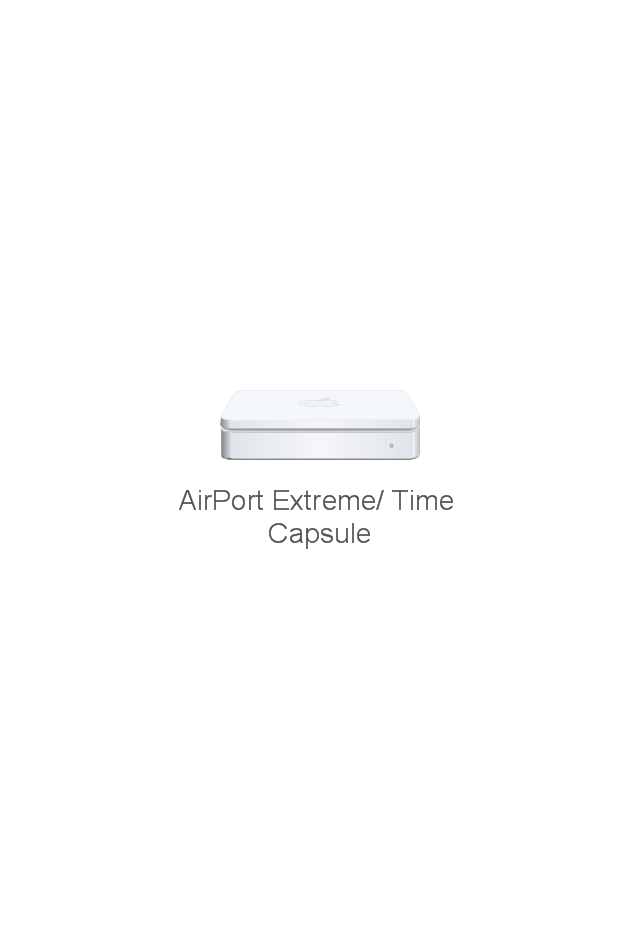
The vector stencils library "Network hardware" contains 27 clipart images and symbols of network equipment for drawing computer network diagrams.
"Networking hardware may also be known as network equipment or computer networking devices. Units which are the last receiver or generate data are called hosts or data terminal equipment.
All these terms refer to devices facilitating the use of a computer network. Specifically, they mediate data in a computer network. ...
Typically, networking hardware includes gateways, routers, network bridges, switches, hubs, and repeaters. But it also includes hybrid network devices such as multilayer switches, protocol converters, bridge routers, proxy servers, firewalls, network address translators, multiplexers, network interface controllers, wireless network interface controllers, modems, ISDN terminal adapters, line drivers, wireless access points, networking cables and other related hardware.
The most common kind of networking hardware today is a copper-based Ethernet adapter because of its standard inclusion on most modern computer systems. Wireless networking has, however, become increasingly popular, especially for portable and handheld devices.
Other hardware prevalent in computer networking includes data center equipment (such as file servers, database servers and storage areas), network services (such as DNS, DHCP, email, etc.) as well as devices which assure content delivery.
Taking a wider view, mobile phones, PDAs and even modern coffee machines may also be considered networking hardware. As technology advances and IP-based networks are integrated into building infrastructure and household utilities, network hardware will becomes an ambiguous term owing to the vastly increasing number of "network capable" endpoints." [Networking hardware. Wikipedia]
The clip art example "Network hardware -Vector stencils library" was created using the ConceptDraw PRO diagramming and vector drawing software extended with the Computer and Networks solution from the Computer and Networks area of ConceptDraw Solution Park.
www.conceptdraw.com/ solution-park/ computer-and-networks
Export from ConceptDraw DIAGRAM Document to a Graphic File
Now it’s easy to share your visual documents with other people in a form most convenient for them. ConceptDraw DIAGRAM can save your drawings and diagrams in a number of highly useful formats, including graphic files. You can save your drawing as a.PNG,.JPG, or other graphic format file.
- Time Vector Png
- Computer and Internet use at home over time | Time Png Vector ...
- Time - Vector stencils library | Time - Vector stencils library | Time ...
- Time - Vector stencils library | Travel and tourism pictograms - Vector ...
- Time , quality, money triangle diagram | Time - Vector stencils library ...
- Sand Watch Vector Png
- Time and clock pictograms - Vector stencils library | Time - Vector ...
- Pyramid Diagram | Time - Vector stencils library | Time and clock ...
- Time Is Money Vector Png
- Watch Vector Png
- Time and clock pictograms - Vector stencils library | Time and clock ...
- Network Icon | Time and clock pictograms - Vector stencils library ...
- Time , quality, money triangle diagram | Currency - Vector stencils ...
- Success Png Vectors
- Design elements - Time series charts | Chart Examples | Chart ...
- People - Vector stencils library | Time - Design Elements | Holiday ...
- Partnership Clipart Png
- Vector Png Of Finance
- DroidDia PRO unlocker | HR symbols - Vector stencils library | HR ...
- Advertising - Vector stencils library | Export from ConceptDraw PRO ...

























































































-hr-workflow---vector-stencils-library.png--diagram-flowchart-example.png)
















-hr-workflow---vector-stencils-library.png--diagram-flowchart-example.png)

















-iphone-interface---vector-stencils-library.png--diagram-flowchart-example.png)
-iphone-interface---vector-stencils-library.png--diagram-flowchart-example.png)














-iphone-interface---vector-stencils-library.png--diagram-flowchart-example.png)


-iphone-interface---vector-stencils-library.png--diagram-flowchart-example.png)
-iphone-interface---vector-stencils-library.png--diagram-flowchart-example.png)
-iphone-interface---vector-stencils-library.png--diagram-flowchart-example.png)
-iphone-interface---vector-stencils-library.png--diagram-flowchart-example.png)






-network-hardware---vector-stencils-library.png--diagram-flowchart-example.png)
-network-hardware---vector-stencils-library.png--diagram-flowchart-example.png)
-network-hardware---vector-stencils-library.png--diagram-flowchart-example.png)
-network-hardware---vector-stencils-library.png--diagram-flowchart-example.png)
-network-hardware---vector-stencils-library.png--diagram-flowchart-example.png)
