 What are Infographic Area
Solutions of the area What is Infographics from ConceptDraw Solution Park collect templates, samples and vector stencils libraries with design elements for the drawing information graphics.
HelpDesk
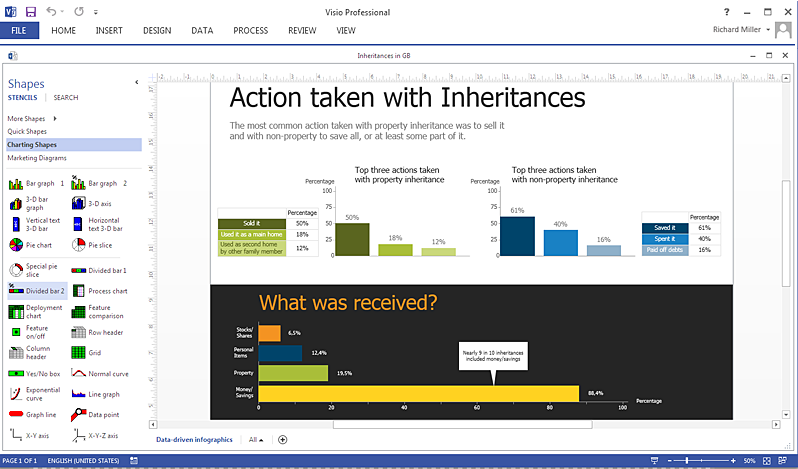
How To Create a MS Visio Data-driven Infographics Using ConceptDraw PRO
ConceptDraw PRO allows you to easily create data-driven infographics of any complexity and then make a MS Visio file from your diagram in a few simple steps.HelpDesk
How to Create Management Infographics Using ConceptDraw PRO
Management might want to communicate a basic workflow for each division of the company, visualise business strategy and decision processes, or display a certain business training concept. In this case, an infographic can be more text heavy, and use illustrations to establish a timeline, process, or step-by-step sequence of events. ConceptDraw PRO can be used as a tool for creating management infographics. It allows you to draw infographics quickly and easily using the special templates and vector stencils libraries. Infographics can be used to quickly communicate a message, to simplify the presentation of large amounts of data, to see data patterns and relationships, and to monitor changes in variables over time. It can contain bar graphs, pie charts, histograms, line charts, e.t.c.HelpDesk
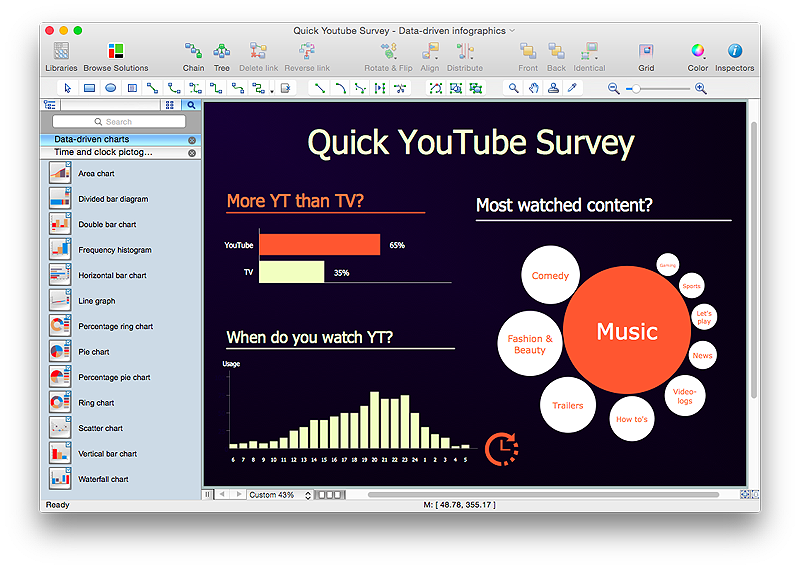
How to Create Data-driven Infographics
Data-driven infographics are used in wildly disparate areas of business and commerce. To make effective Data-driven infographics, it's useful to have a wide variety of graphical elements — icons, clipart, stencils, charts and graphs — to illustrate your diagram. ConceptDraw Data-driven Infographics solution provides all the tools you need to present data as described by this article — as well as the charts mentioned previously, you can find histograms, divided bar charts, ring charts, line graphs and area charts — meaning you can find the perfect medium for displaying a certain type of data. It allows you to draw data driven infographics quickly and easily using the special templates and vector stencils libraries.It can be used to quickly communicate a message, to simplify the presentation of large amounts of data, to see data patterns and relationships, and to monitor changes in variables over time.HelpDesk
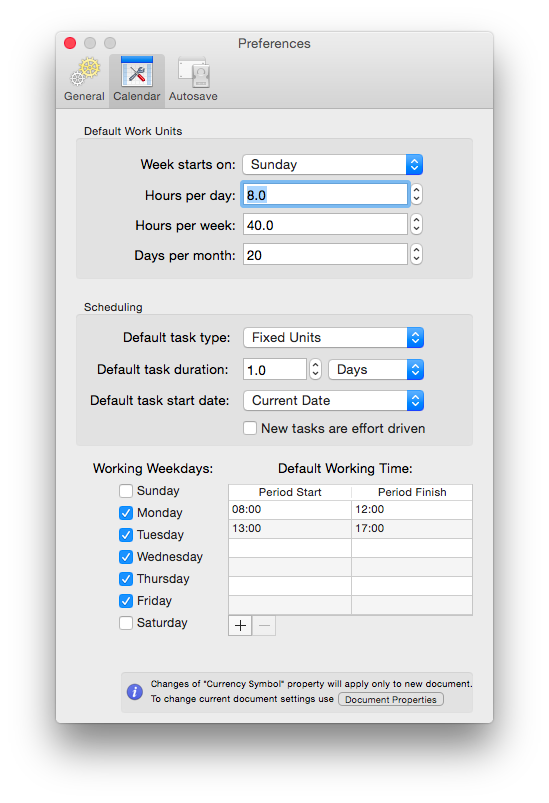
How to Change the Working Time in a Project
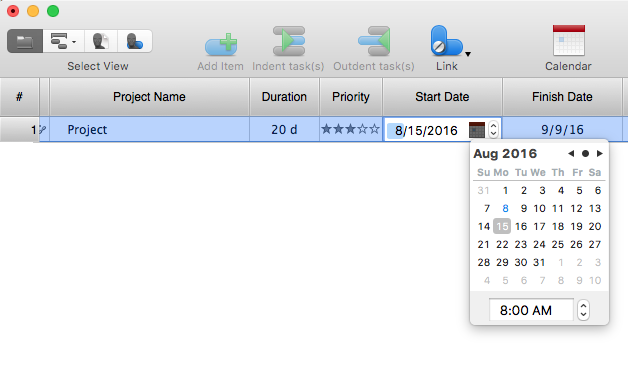
Project calendar determines working and non-working time of the project. It is used as a base to the project schedule development. There two types of project calendars: Project Calendar - which sets the working time for the whole project; and the Resource Calendar- which sets the working time of the particular project resource. The following article describes how to change the default calendar in ConceptDraw PROJECT.How to draw Metro Map style infographics? Moscow, New York, Los Angeles, London
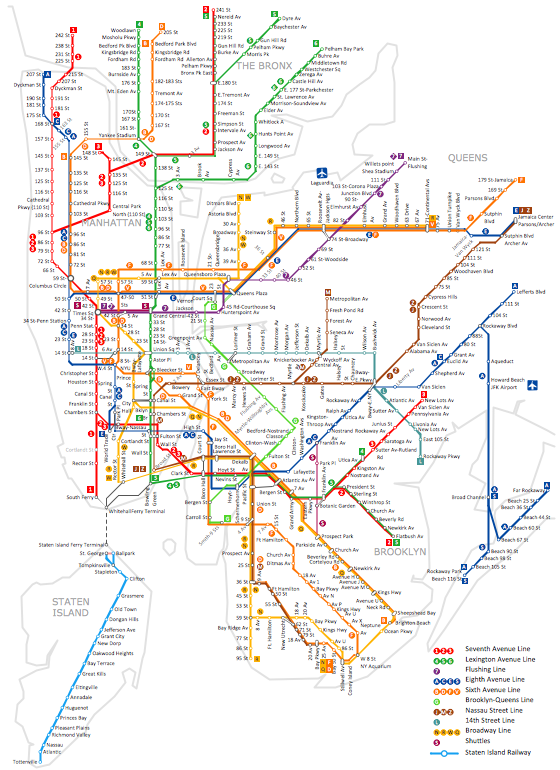
The solution handles designs of any complexity, and the comprehensive library covers all key aspects of a transportation system. To further enhance your map design, there is the option to embed links, that can display station images or other relevant, important information. We have also included a set of samples in the solution, that show the possible real-world application — complex tube systems including the London Tube and New York City Subway show the level of detail possible when using the Metro Map Solution.How to Draw Pictorial Chart. How to Use Infograms
How to draw pictorial chart quick, easy and effective? ConceptDraw PRO offers the unique Pictorial Infographics Solution that will help you! Pictorial Infographics solution contains large number of libraries with variety of predesigned vector pictograms that allows you design infographics in minutes. There are available 10 libraries with 197 vector pictograms.HelpDesk
How to Connect Text Data to a Time Series Chart on Your Live Dashboard
Time Series Dashboard means an integration of some type of diagrams: Line Charts, Bar Charts, Column Charts, and Dot Plots on a single space. The ConceptDraw Time Series Dashboard solution can be used to create the interactive Time Series dashboard. The libraries of Time Series Charts solution contain the Live Objects, that can change their appearance depending on the external data. Each chart from the Time Series dashboard displays particular source data. You can include Time Series Charts in your business or technical dashboards to show and compare the items changing over time.
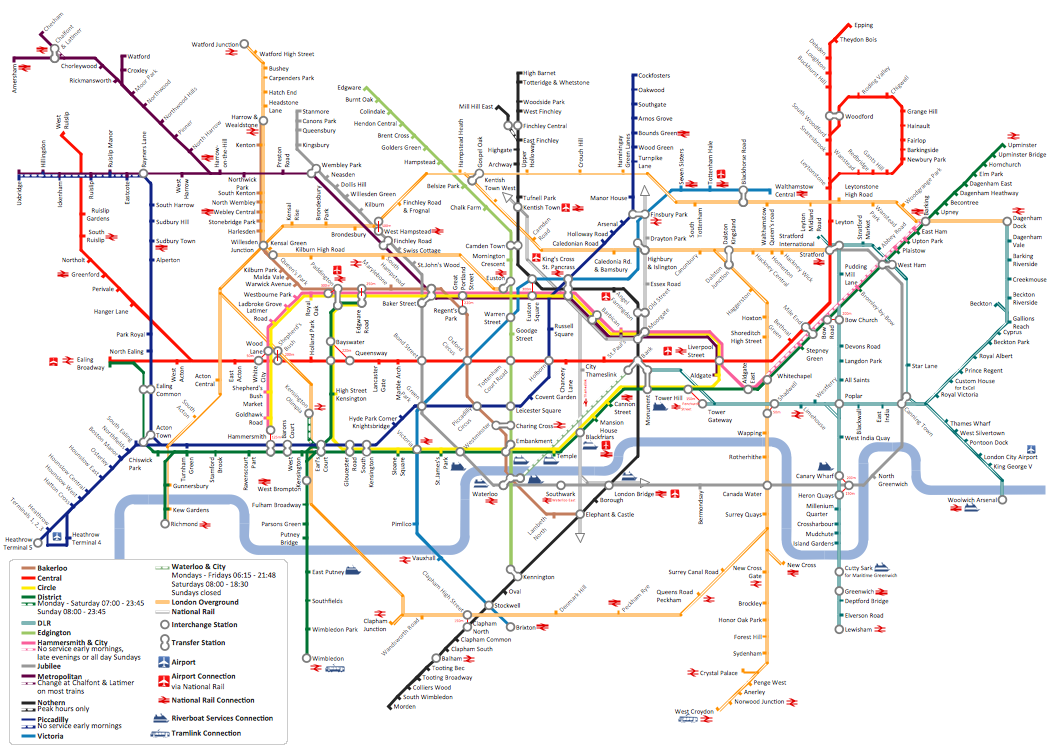
How to draw Metro Map style infographics? (London)
Tool to draw Metro Map styled inforgraphics. London Tube map sample.Spatial infographics Design Elements: Transport Map
Do you like infographics and data visualization? Creating infographics is super-easy with ConceptDraw.How to draw Metro Map style infographics? (New York)
How to draw Metro Map style infographics of New York subway. New York Subway has a long history starting on October 27, 1904. Since the opening many agencies have provided schemes of the subway system. At present time are 34 lines in use. This page present New York City subway map construct with Metro Map Solution in Conceptdraw PRO software. This is a one-click tool to add stations to the map. It lets you control the direction in which you create new stations, change lengths, and add text labels and icons. It contains Lines, Stations, and Landmarks objectsHelpDesk
How to Operate with Project Time Frames in ConceptDraw PROJECT
ConceptDraw PROJECT applies an advanced scheduling facilities to enable you arrange your project's tasks with existing human and material resources. Comprehension of project scheduling principle allows you to plan the project the best way to execute it. Sometimes user is wondering why the task is moved to a different time than he supposed. Or he may be confused when a task's tardiness provoke the unwanted shift of other tasks. This article describes how do changes to the Start/Finish dates, or the Duration of the task affect the project schedule, created in ConceptDraw PROJECT.- Ecommerce Work Flow Infographics
- Design Pictorial Infographics . Design Infographics | Infographic ...
- Design Pictorial Infographics . Design Infographics | Time and clock ...
- Marketing Plan Infographic | Flowchart Example: Flow Chart of ...
- Process Flowchart | How to Create Management Infographics Using ...
- Time Sheet Infographic
- Picture Graphs | Infographic Maker | Visual Presentations Made ...
- Marketing Time Scale
- Marketing Plan Infographic | Design elements - Marketing ...
- Marketing Plan Infographic | Target Diagram | Flowchart Marketing ...
- Design Pictorial Infographics . Design Infographics | How to Draw ...
- How to Create Education Infographics | Best Value Stream Mapping ...
- Cross-Functional Flowchart | Process Flowchart | How To Convert ...
- Time and clock pictograms - Vector stencils library | Design ...
- Marketing Plan Infographic | HVAC Marketing Plan | Marketing Flow ...
- Time - Vector stencils library | Time and clock pictograms - Vector ...
- Strategy Clock Template | Time - Design Elements | Basketball Court ...
- How to Create Education Infographics | Basic Flowchart Symbols ...
- How to Create a Gantt Chart for Your Project | Process Flowchart ...
- HVAC Marketing Plan | Marketing Plan Infographic | Marketing Flow ...
