Lean Six Sigma Diagram Software
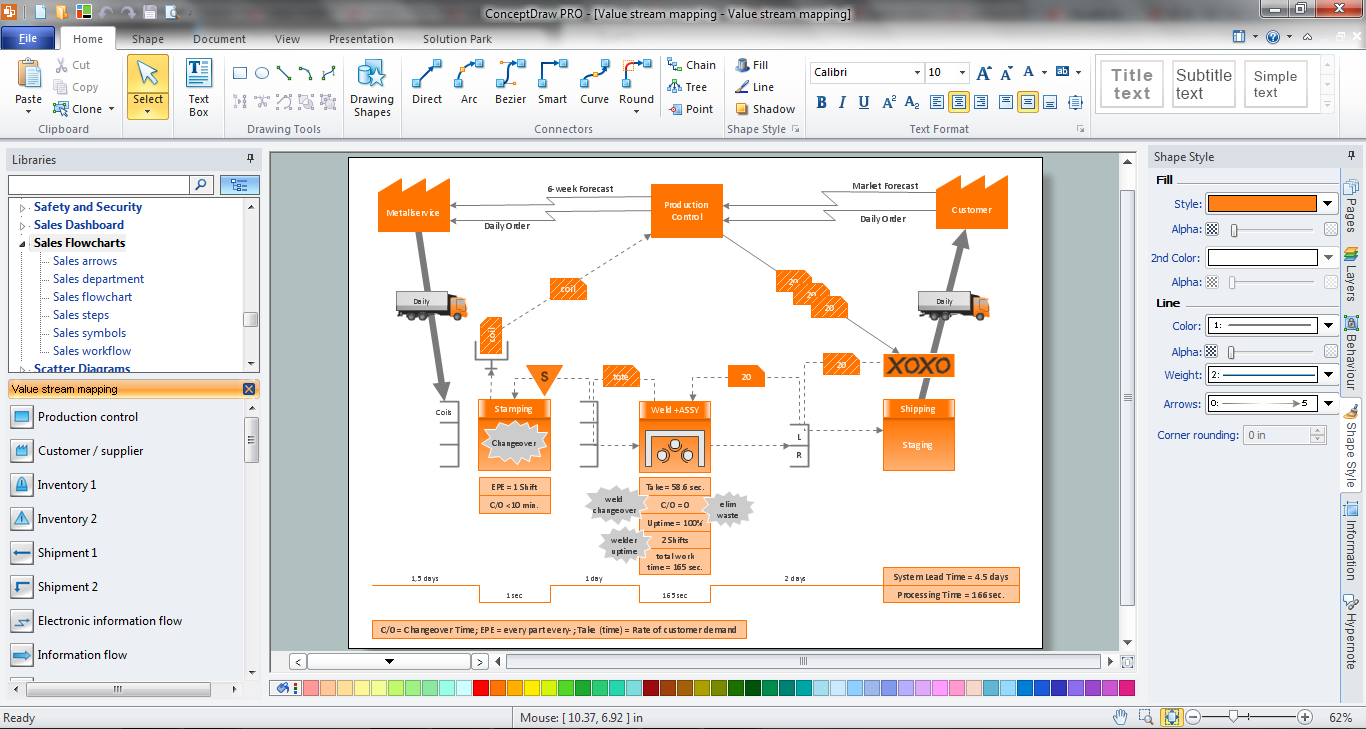
Lean Six Sigma (LSS) is a well-known in all over the world methodology of quality improvement and business perfection. ConceptDraw PRO diagramming and vector drawing software is a powerful Lean Six Sigma Diagram Software thanks to the included Value Stream Mapping solution from the Quality Management Area of ConceptDraw Solution Park.Value Stream Mapping Template
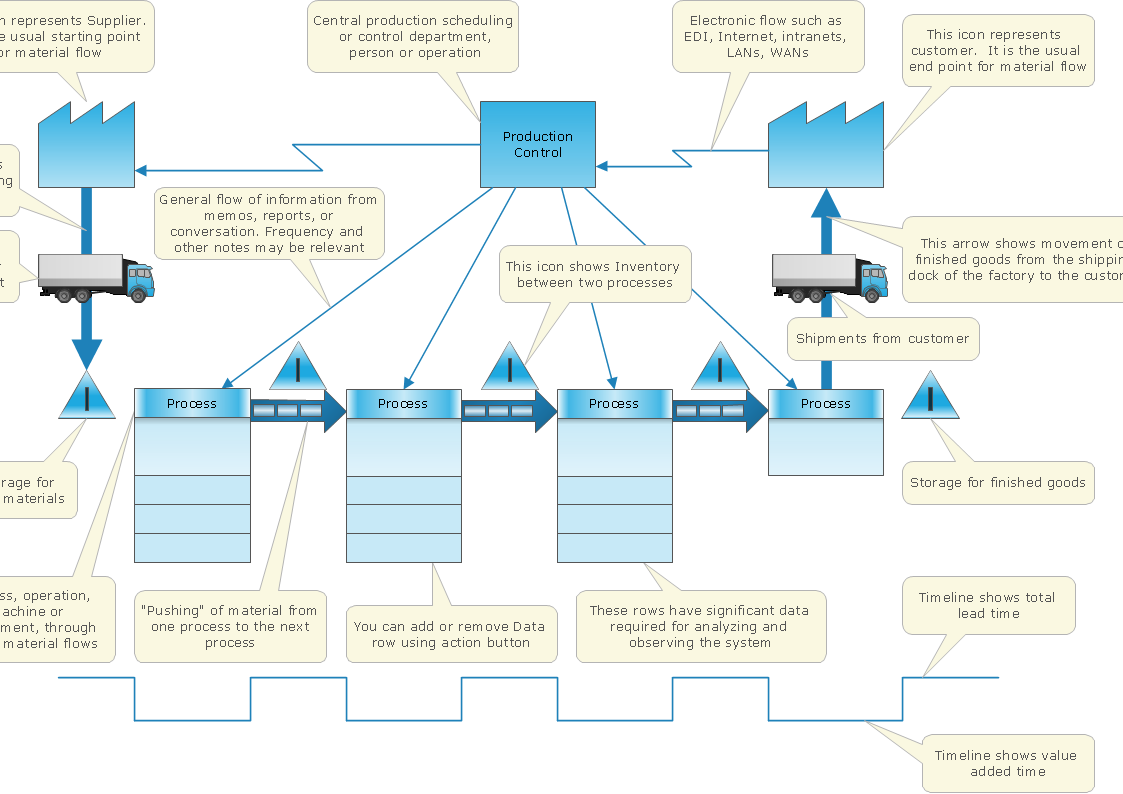
Use ConceptDraw PRO extended with Value Stream Mapping solution for document processes with professional designed Value Stream Mapping template.How To create Value Stream Map (VSM)
Value Stream Map template helps you to create VSM diagrams using ConceptDraw PRO software.Lean Manufacturing Diagrams
The Value Stream Mapping solution continues to extend the range of ConceptDraw PRO into a business graphics tool that can be used to document processes of Lean Manufacturing.
 Value Stream Mapping
Value stream mapping solution extends ConceptDraw PRO software with templates, samples and vector stencils for drawing the Value Stream Maps (VSM) in lean manufacturing practice.
Best Value Stream Mapping mac Software
Create value stream maps - for value stream analysis and value stream management, material and information flow mapping, using our quick start templates included with ConceptDraw.Cause and Effect Diagram
ConceptDraw PRO software extended with Fishbone Diagrams solution from the Management area of ConceptDraw Solution Park is perfect for Cause and Effect Diagram creating. It gives the ability to draw fishbone diagram that identifies many possible causes for an effect or a problem. Causes and Effects are usually grouped into major categories to identify these sources of variation. Causes and Effects in the diagram show relationships among various factor. Fishbone diagram shows factors of Equipment, Process, People, Materials, Environment and Management, all affecting the overall problem.Quality Engineering Diagrams
Create Quality Engineering Diagrams (value stream maps) - for value stream analysis and value stream management, material and information flow mapping, using our quick start templates included with ConceptDraw.Mind Mapping in the Quality Management
ConceptDraw MINDMAP has a addition to the ConceptDraw Solution Park that provides a creative approach to visualizing quality processes, Quality Mind Map Solution.Value Stream Mapping
Use ConceptDraw Value Stream Maps (VSM) visualization for a manufacturing plant the material and information flow required to deliver a product/service to customers. The new Value Stream Mapping solution found in the ConceptDraw Solution Park continues to extend the range of ConceptDraw PRO into a business graphics tool that can be used to document processes in any organization.- How To create Value Stream Map (VSM) | What is Value Stream ...
- Value Stream Mapping for the Lean Office
- Value Stream Mapping | The Lean Enterprise Value Stream ...
- Value Stream Mapping for the Lean Office | The Lean Enterprise ...
- Value-Stream Mapping for Manufacturing | Mind Mapping in the ...
- How Do Fishbone Diagrams Solve Manufacturing Problems ...
- Lean Manufacturing Diagrams | VSM | Value Stream Mapping ...
- Value Stream Mapping for the Lean Office | Lean Manufacturing ...
- Value Stream Mapping for the Lean Office | IDEF0 Diagrams | DFD ...
- Lean Manufacturing Diagrams | Value-Stream Mapping for ...


