Basic Flowchart Symbols and Meaning


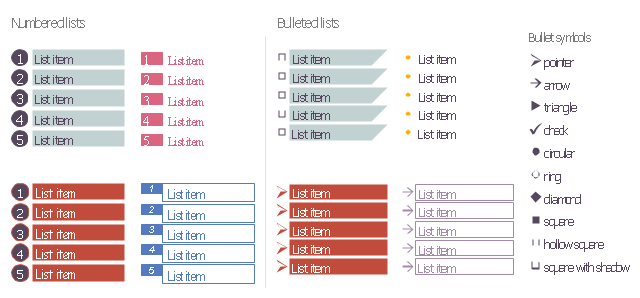
The vector stencils library "Education list blocks" contains 18 list block shapes: numbered list, bulleted list, bullets.
Use these list blocks to design your educational infograms.
"In typography, a bullet is a typographical symbol or glyph used to introduce items in a list. ...
The bullet symbol may take any of a variety of shapes, such as circular, square, diamond, arrow, etc. ...
Bullets are most often used in technical writing, reference works, notes and presentations. ...
Bulleted items – known as "bullet points" – may be short phrases, single sentences, or of paragraph length. Bulleted items are not usually terminated with a full stop if they are not complete sentences, although it is not rare to terminate every item except the last one with a semicolon, and terminate the last item with a full stop. It is correct to terminate a bullet point with a full stop if the text within that item consists of one 'full' sentence or more." [Bullet (typography). Wikipedia]
The shapes example "Design elements - Education list blocks" was created using the ConceptDraw PRO diagramming and vector drawing software extended with the Education Infographics solition from the area "Business Infographics" in ConceptDraw Solution Park.
Numbered lists, bulleted lists, bullets
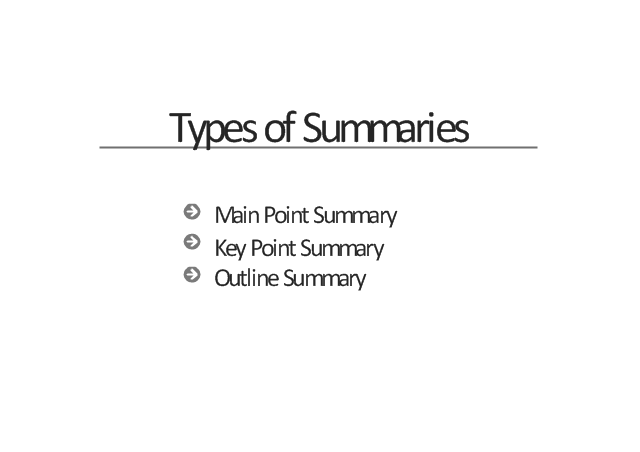
This presentation slide example contains a list of bullet points.
"In typography, a bullet is a typographical symbol or glyph used to introduce items in a list. ...
It is likely that the name originated from the resemblance of the traditional circular bullet symbol to an actual bullet.
The bullet symbol may take any of a variety of shapes, such as circular, square, diamond, arrow, etc., and typical word processor software offer a wide selection of shapes and colours. Several regular symbols are conventionally used in ASCII-only text or another environments where bullet characters are not available, such as * (asterisk), - (hyphen), . (period), and even o (lowercase O). Of course, when writing by hand, bullets may be drawn in any style. Historically, the index symbol was popular for similar uses." [Bullet (typography). Wikipedia]
The presentation slide example "Types of summaries" was created in the ConceptDraw PRO diagramming and vector drawing software using the Presentation Clipart solution from the Illustration area of ConceptDraw Solution Park.
Presentation slide
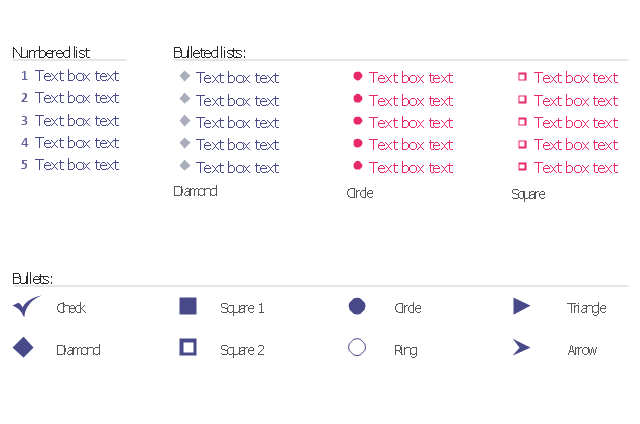
The vector stencils library "Bulleted and numbered lists" contains 12 elements of bulleted and numbered lists, and bullets for creating typography infographics.
"In typography, a bullet ( • ) is a typographical symbol or glyph used to introduce items in a list. ... The bullet symbol may take any of a variety of shapes, such as circular, square, diamond, arrow, etc., and typical word processor software offer a wide selection of shapes and colours. Several regular symbols are conventionally used in ASCII-only text or another environments where bullet characters are not available, such as * (asterisk), - (hyphen), . (period), and even o (lowercase O). Of course, when writing by hand, bullets may be drawn in any style. Historically, the index symbol was popular for similar uses." [Bullet (typography). Wikipedia]
The example "Design elements - Bulleted and numbered lists" was created using the ConceptDraw PRO diagramming and vector drawing software extended with the Typography Infographics solition from the area "What is infographics" in ConceptDraw Solution Park.
Typography infographics elements - Bulleted and numbered lists
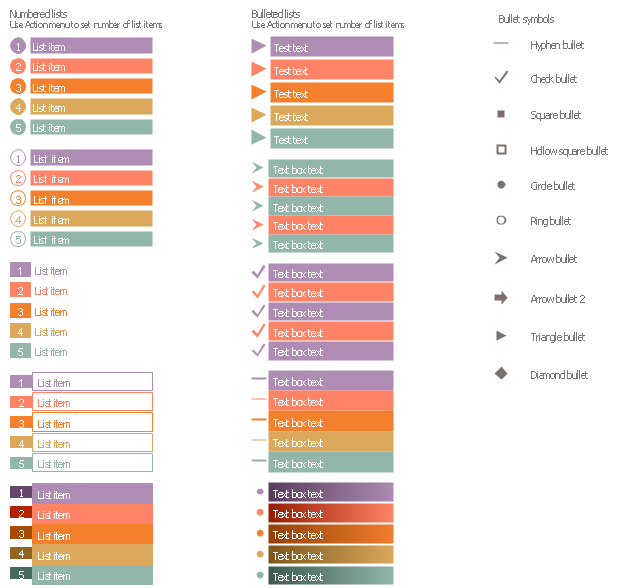
The vector stencils library "List blocks" contains 20 numbered list elements, bulleted list elements and bullet symbols for creating marketing infograms.
"In typography, a bullet ( • ) is a typographical symbol or glyph used to introduce items in a list. ...
The bullet symbol may take any of a variety of shapes, such as circular, square, diamond, arrow, etc., and typical word processor software offer a wide selection of shapes and colours. ...
Bullets are most often used in technical writing, reference works, notes and presentations." [Bullet (typography). Wikipedia]
The shapes example "Design elements - List blocks" was created using the ConceptDraw PRO diagramming and vector drawing software extended with the Marketing Infographics solition from the area "Business Infographics" in ConceptDraw Solution Park.
Lists
HelpDesk
How to Create a Typography Infographic Using ConceptDraw PRO

Cross-Functional Flowchart


HelpDesk
How to Create a Meter Dashboard

Wireframe Tools

HelpDesk
How to Create Management Infographics Using ConceptDraw PRO

The vector stencils library "Management indicators" contains 14 visual indicators.
Use it to create your management infogram in the ConceptDraw PRO diagramming and vector drawing software.
The example "Management indicators - Vector stencils library" is included in the solution "Marketing infographics" from the "Business infographics" area of ConceptDraw Solution Park.
Use it to create your management infogram in the ConceptDraw PRO diagramming and vector drawing software.
The example "Management indicators - Vector stencils library" is included in the solution "Marketing infographics" from the "Business infographics" area of ConceptDraw Solution Park.
1-Sector donut chart

1-Sector pie chart

2-Bars horizontal bar chart

2-Columns arrow chart
2-Columns arrow chart 2
2-Sectors donut chart

2-Sectors pie chart

Bullet indicator

Progress bar

Radial gauge

Semi-radial gauge

Square chart 10x10 - filling from above

Square chart 10x10 - filling from below

Stickman row pictograph

The vector stencils library "Education indicators" contains 12 graphic indicators.
Use these visual indicators to design your educational infogram.
The vector stencils library "Education indicators" is included in the Education Infographics solution from the Business Infographics area of ConceptDraw Solution Park.
Use these visual indicators to design your educational infogram.
The vector stencils library "Education indicators" is included in the Education Infographics solution from the Business Infographics area of ConceptDraw Solution Park.
1-Sector donut chart

2-Sectors donut chart

1-Sector pie chart

2-Sectors pie chart

2-Bars horizontal bar chart

2-Columns arrow chart
Bullet indicator

Progress bar

Radial gauge

Semi-radial gauge

Square chart 10x10 - filling from above

Stickman row pictograph

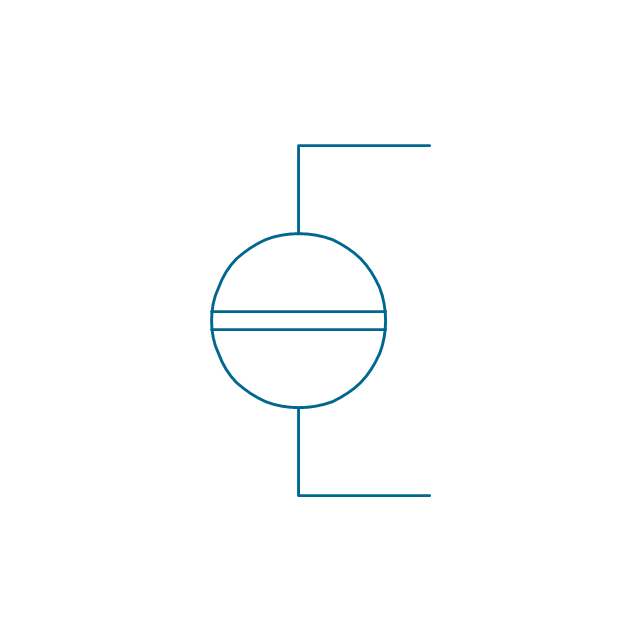
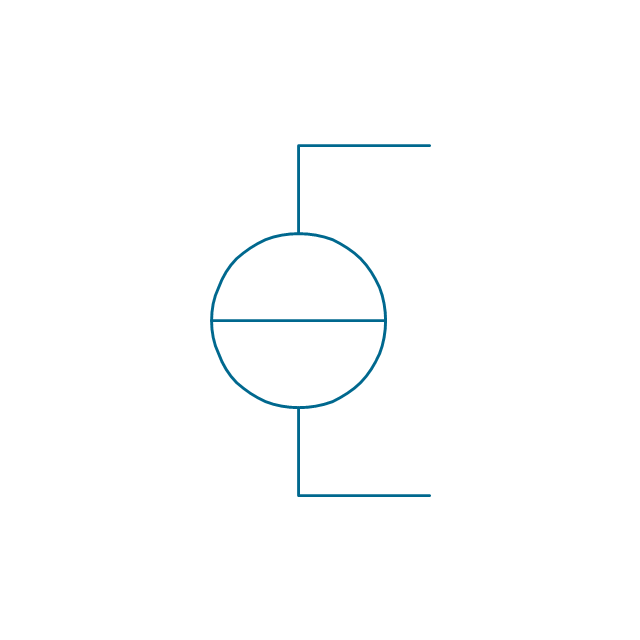
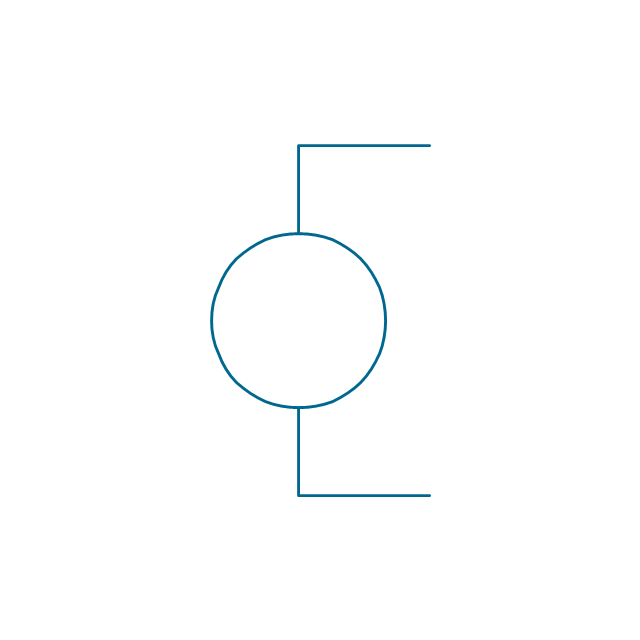
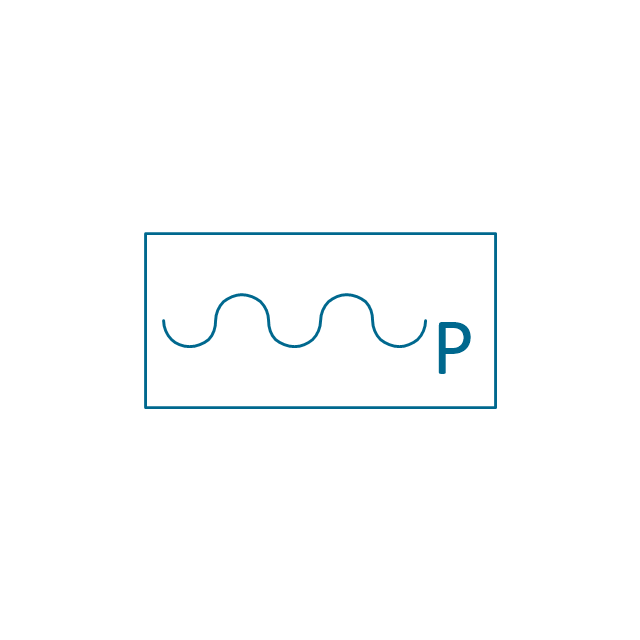
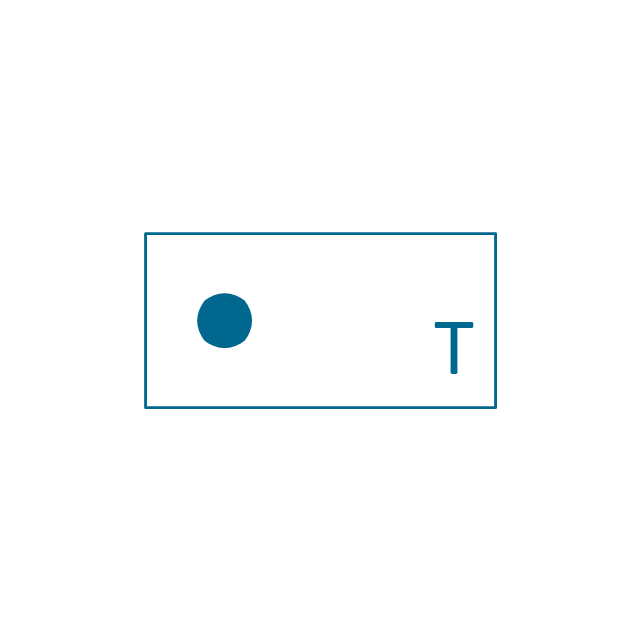
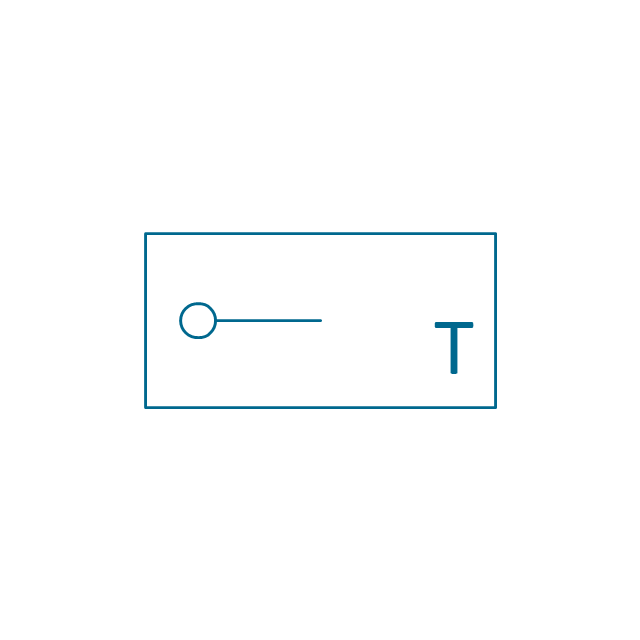
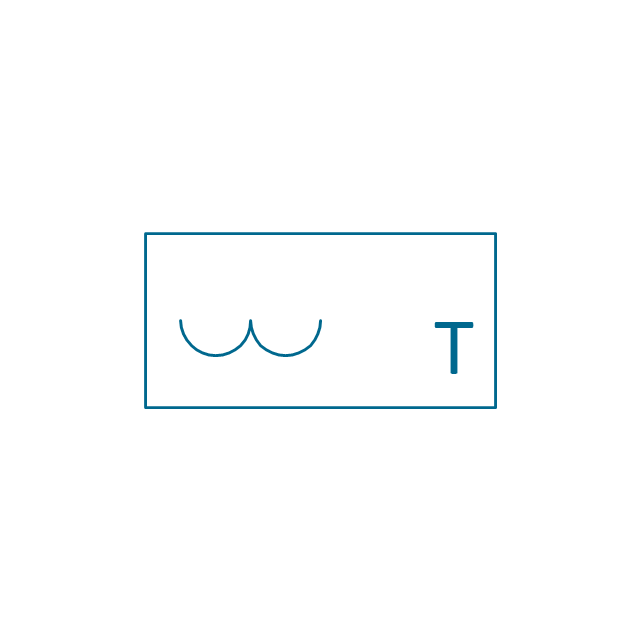
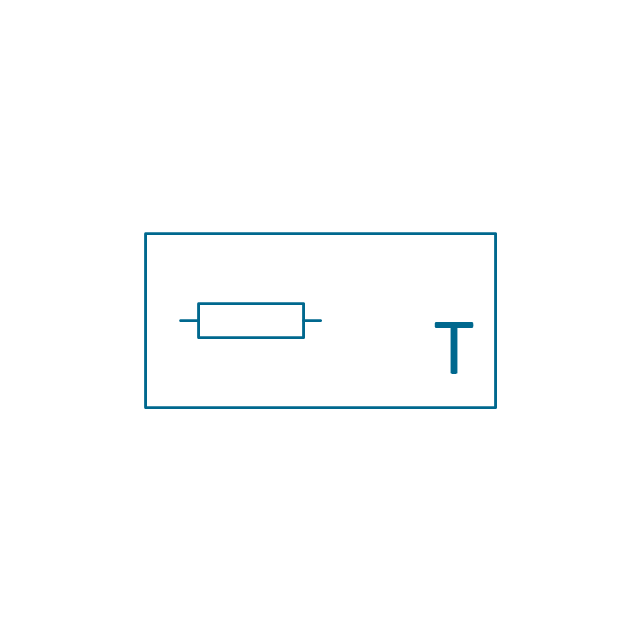
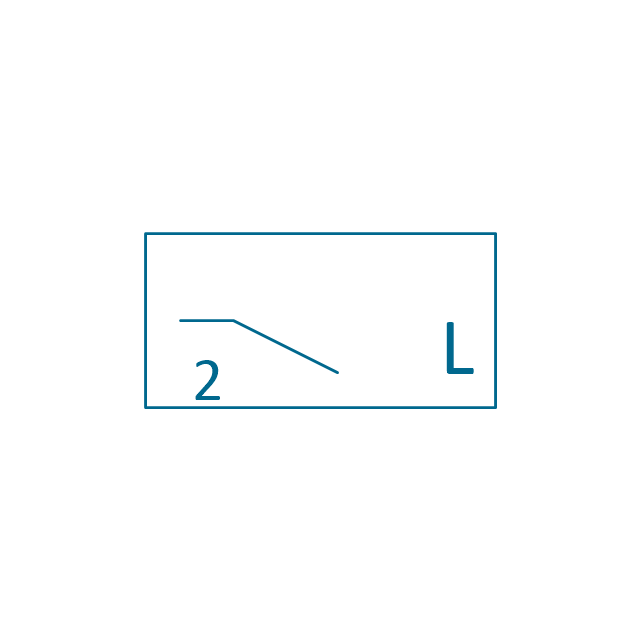
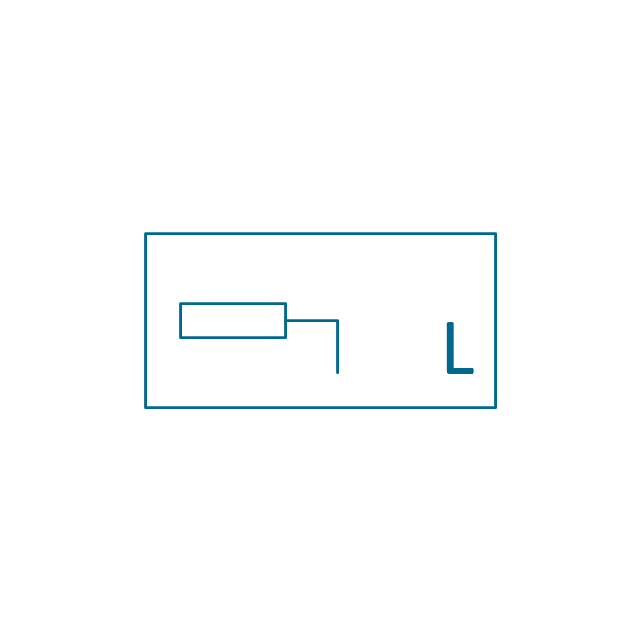
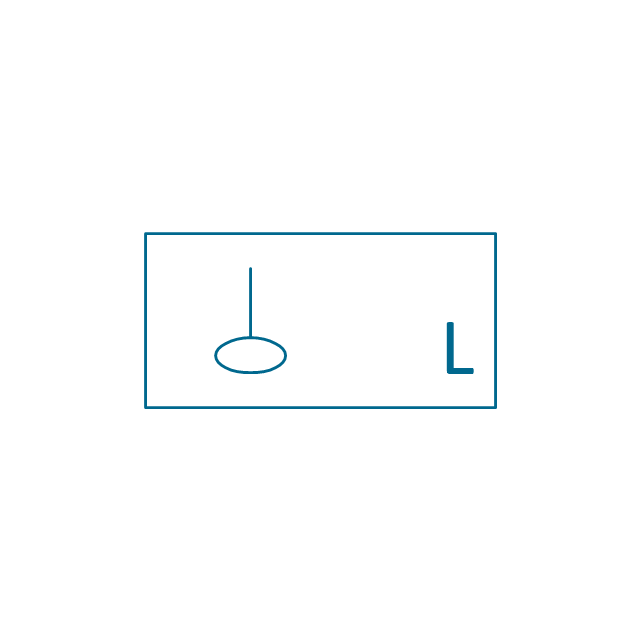
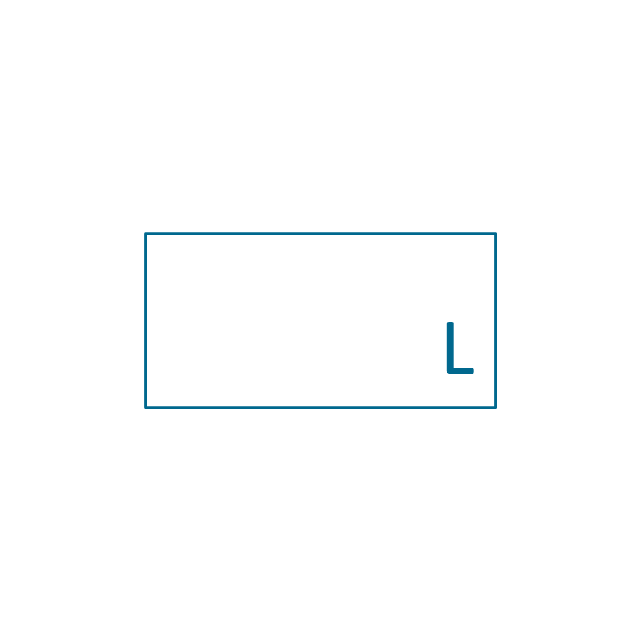
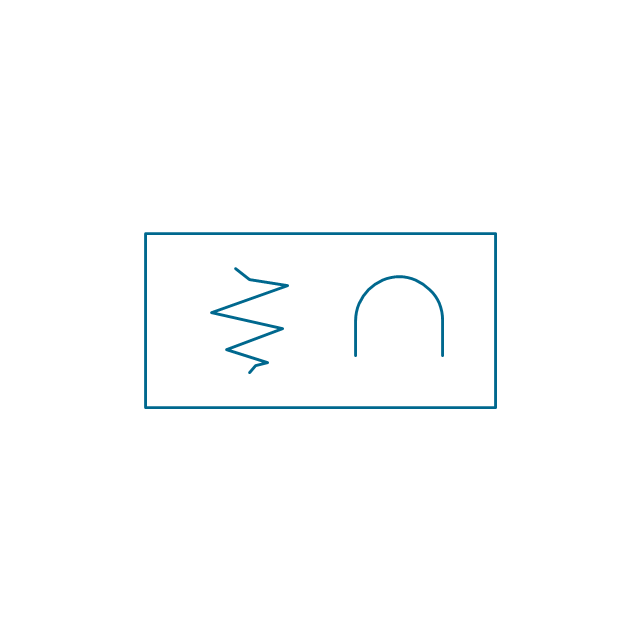
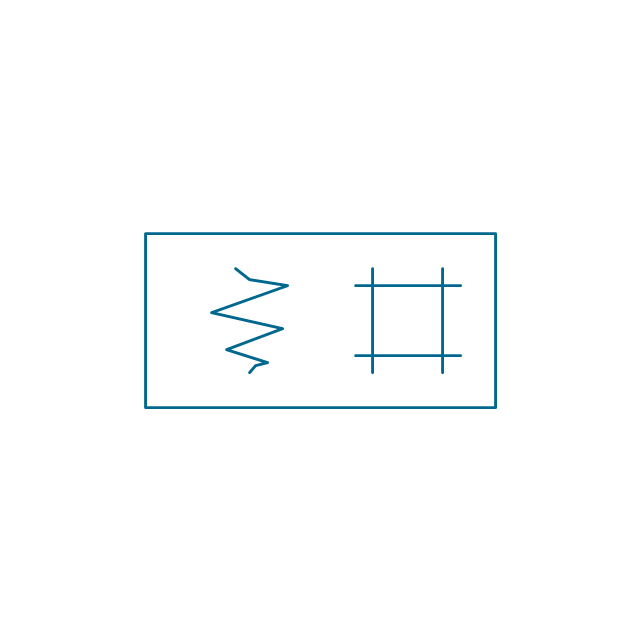
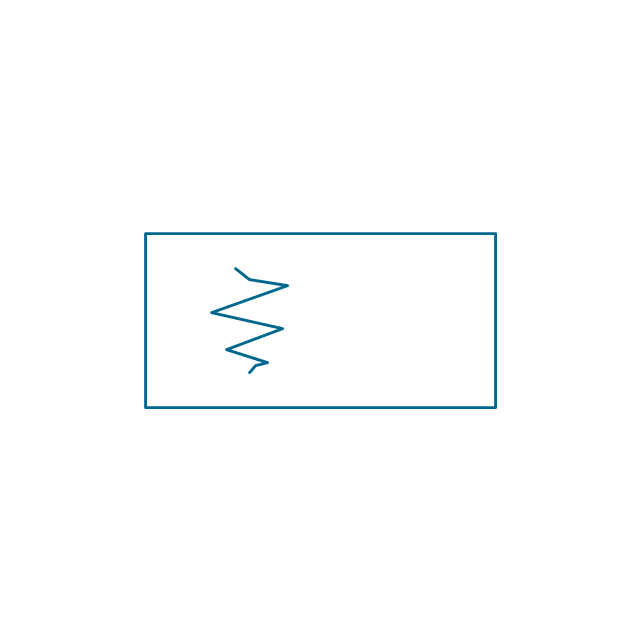
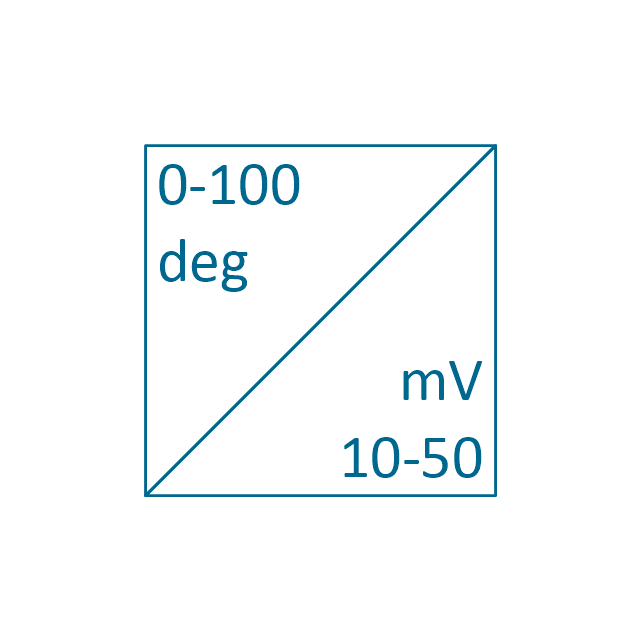
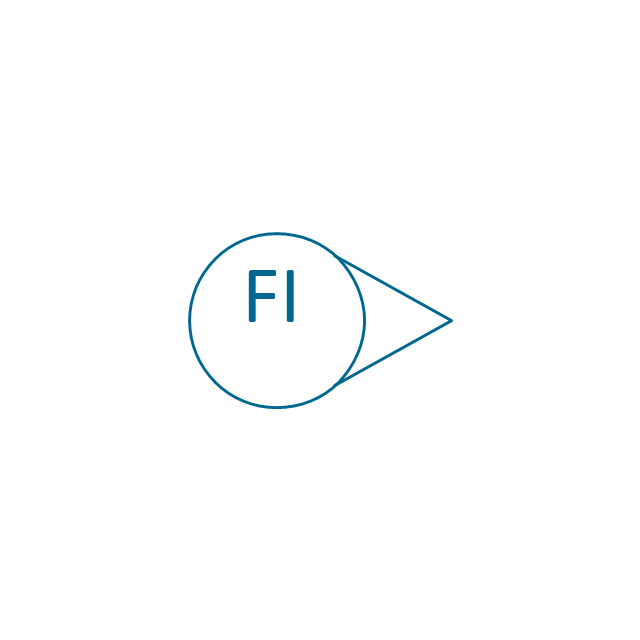
The vector stencils library "Instruments" contains 72 symbols of control instruments and measuring devices: meters and gauges, and callouts, text boxes, and inserts.
Use these shapes to create annotated process flow diagrams (PFD), flow control, manufacturing processes, and distribution system diagrams in the ConceptDraw PRO software extended with the Chemical and Process Engineering solution from the Chemical and Process Engineering area of ConceptDraw Solution Park.
www.conceptdraw.com/ solution-park/ engineering-chemical-process
Indicator local

Indicator remote
Indicator auxiliary
CRT local
CRT remote
CRT auxiliary
PLC local
PLC auxiliary
PLC remote
Computer local
Computer auxiliary
Computer remote
Light local
Light remote
Light auxiliary
Indicator auxiliary (dashed)
-instruments---vector-stencils-library.png--diagram-flowchart-example.png)
Indicator remote (dashed)
-instruments---vector-stencils-library.png--diagram-flowchart-example.png)
Steam traced auxiliary
Steam traced remote
Steam traced local

Level meter auxiliary
Level meter remote
Level meter local
Pressure gauge diaphragm
Pressure gauge
Pressure gauge liquid filled
Strain gauge
Thermometer bi-metallic
Thermometer gas
Thermometer general

Thermometer glass
Thermometer liquid
Thermometer resistance
Thermometer thermocouple
Flowmeter electromagnetic
Flowmeter general

Flowmeter nozzle
Flowmeter orifice
Flowmeter positive displacement
Flowmeter turbine

Flowmeter variable area
Flowmeter Venturi
Level meter capacitive
Level meter conductive
Level meter displacer
Level meter float
Level meter general
Level meter sonic
Indicator analoque
Indicator digital
Indicator general
Recorder analoque
Recorder digital
Recorder general
Converter
Converter 2 (1st half filled)
-instruments---vector-stencils-library.png--diagram-flowchart-example.png)
Converter 3 (2nd half filled)
-instruments---vector-stencils-library.png--diagram-flowchart-example.png)
Venturi
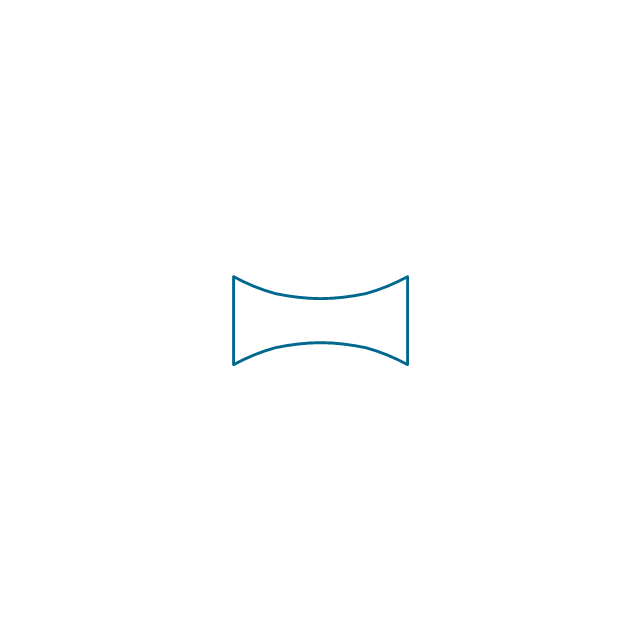
Venturi (pressure taps)
-instruments---vector-stencils-library.png--diagram-flowchart-example.png)
Flowmeter
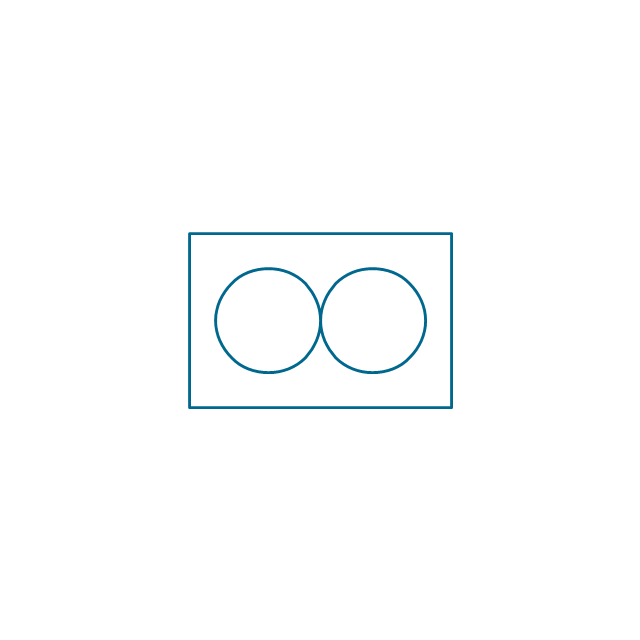
Rotameter
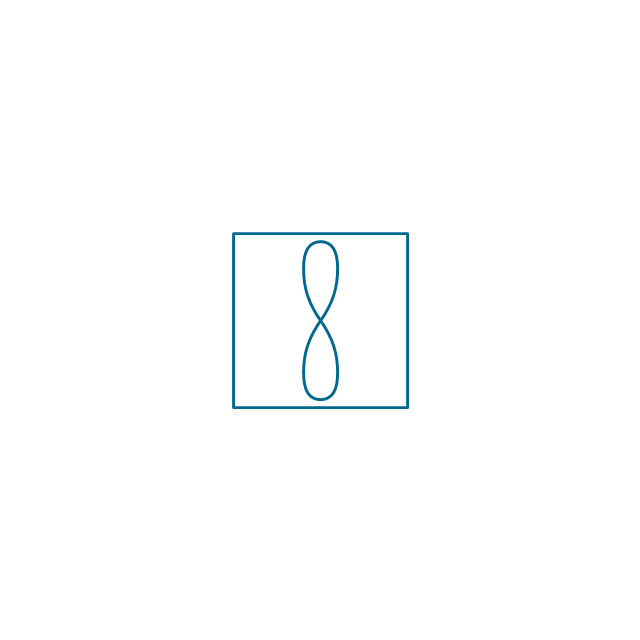
Vortex sensor

Propeller meter
Generic utility
Operator box
Operator box 2 (1st half filled)
-instruments---vector-stencils-library.png--diagram-flowchart-example.png)
Operator box 3 (2nd half filled)
-instruments---vector-stencils-library.png--diagram-flowchart-example.png)
AND gate
OR gate
NOT gate
Correcting element
Diamond
Basic Flowchart Examples

SWOT Analysis

- Design elements - Education list blocks | Basic Flowchart Symbols ...
- Types of summaries - Slide sample | Design elements - Bulleted and ...
- Basic Flowchart Symbols and Meaning | Design elements ...
- Basic Flowchart Symbols and Meaning | Design elements - Text ...
- Design elements - Bulleted and numbered lists | Design elements ...
- Typography Bullet Lists
- Types of summaries - Slide sample | Square Bullets
- List Bullet Png
- Basic Flowchart Symbols and Meaning | Design elements - List ...
- Triangular Bullet Typography
- Basic Flowchart Symbols and Meaning | How to Create a ...
- Types of summaries - Slide sample | Design elements - Sales KPIs ...
- Design elements - Bulleted and numbered lists | Design elements ...
- Design elements - Bulleted and numbered lists | Design elements ...
- Design elements - Bulleted and numbered lists | How to Create a ...
- Design elements - Education list blocks | Design elements - Bulleted ...
- How to Create a Typography Infographic Using ConceptDraw PRO ...
- Diamond Bullets
- Basic Flowchart Symbols and Meaning | UML Notation | Business ...
- Type Of Bullets Typography