Basic Flowchart Symbols and Meaning


Entity Relationship Diagram Symbols

 Education Package
Education Package is a comprehensive set of multifarious graphical solutions from ConceptDraw Solution Park, collected together in help to ConceptDraw DIAGRAM users working in a field of science, education and training, which is aimed at improving the quality of education and helping to design with ease variety of interesting and colorful educational materials, diagrams, charts and maps. Use it to present the information and knowledge in an interesting, clear, structured and simple form to achieve a success in education and pedagogy, to maintain the interest of students and pupils throughout the whole learning process, at the lectures, lessons and even during independent work with additional materials, to contribute to better perception of scientific information by listeners during the conferences and reports.
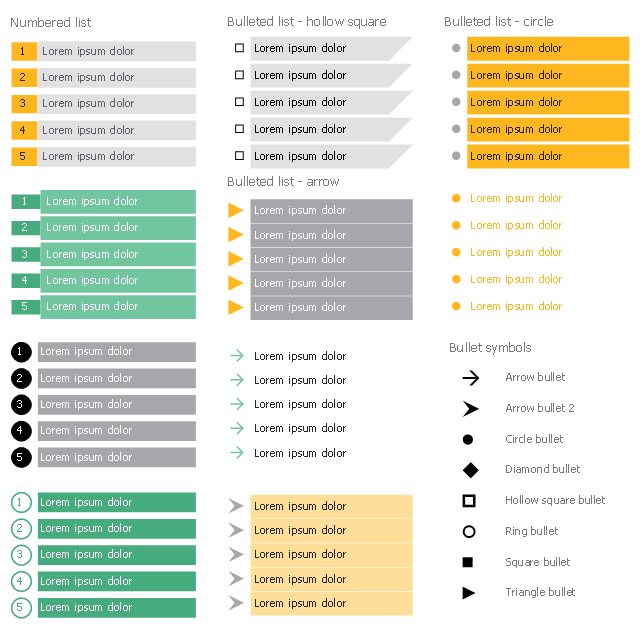
The vector stencils library "Financial lists" contains 18 list elements, including bulleted and numbered lists.
"In typography, a bullet is a typographical symbol or glyph used to introduce items in a list. ...
The bullet symbol may take any of a variety of shapes, such as circular, square, diamond or arrow." [Bullet (typography). Wikipedia]
Use it to design your financial infographics.
"In typography, a bullet is a typographical symbol or glyph used to introduce items in a list. ...
The bullet symbol may take any of a variety of shapes, such as circular, square, diamond or arrow." [Bullet (typography). Wikipedia]
Use it to design your financial infographics.
Infographic elements
Data Flow Diagram Symbols. DFD Library

Types of Flowcharts


UML Notation

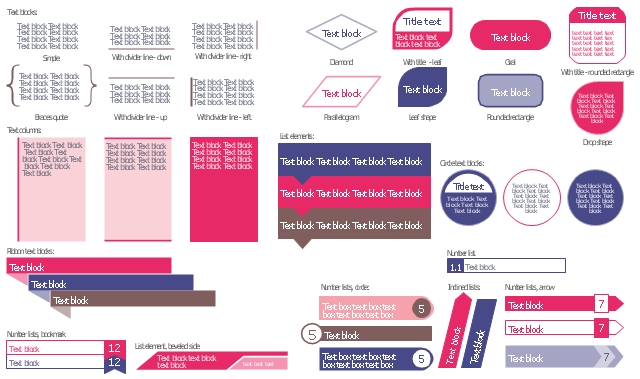
The vector stencils library "Text blocks" contains 38 text blocks including braces quote, blocks with divider line, text columns, list and numbered list elements, inclined list elements, blocks, different shape blocks (arrow, ribbon, circle, rounded rectangle, oval, diamond, parallelogram, leaf, drop), titled text blocks. Use it to add typography elements into your infographics.
The example "Text blocks" was created using the ConceptDraw PRO diagramming and vector drawing software extended with the Typography Infographics solition from the area "What is infographics" in ConceptDraw Solution Park.
The example "Text blocks" was created using the ConceptDraw PRO diagramming and vector drawing software extended with the Typography Infographics solition from the area "What is infographics" in ConceptDraw Solution Park.
Typography infographics elements - Text blocks
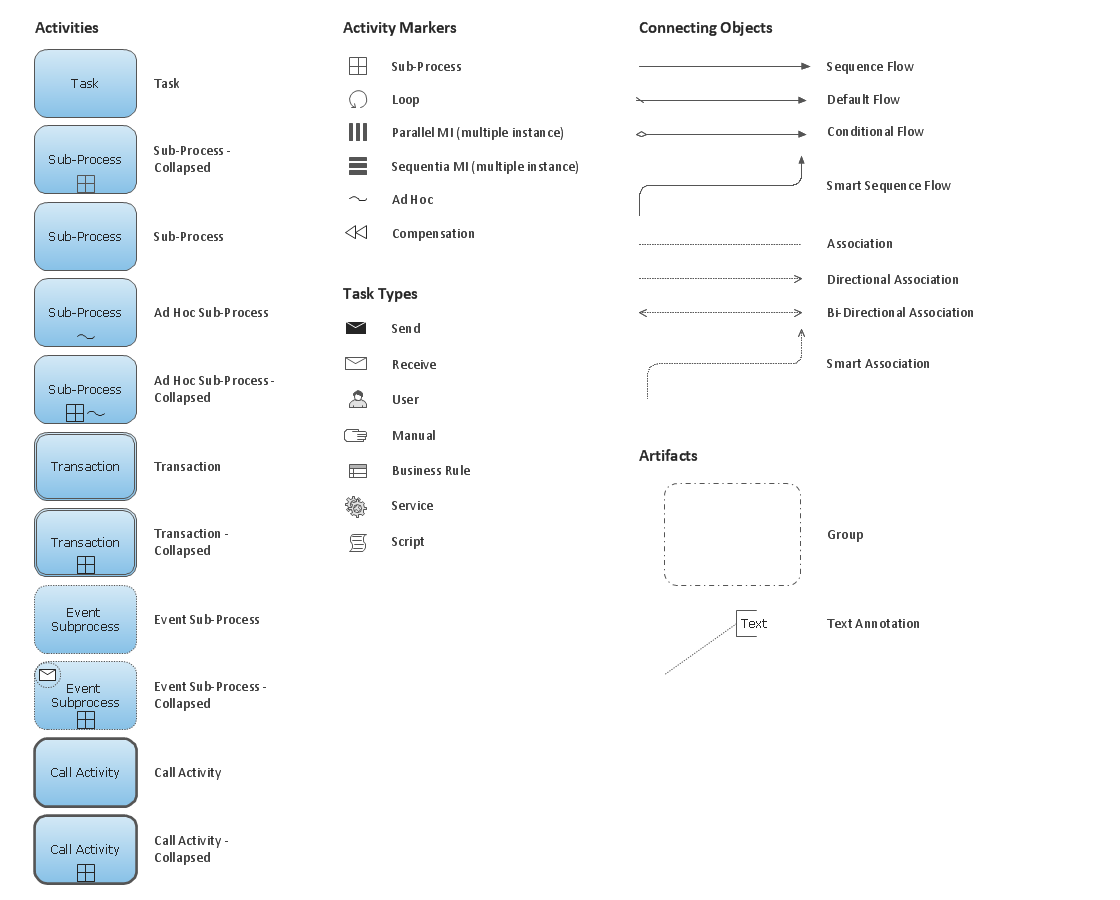
Business Process Elements: Activities

- Entity Relationship Diagram Symbols | ERD Symbols and Meanings ...
- Components of ER Diagram | Entity Relationship Diagram Symbols ...
- Atmosphere air composition | Percentage Pie Chart. Pie Chart ...
- Design elements - Management list blocks | Design elements - List ...
- Design elements - Text blocks | CMP adaptive management cycle ...
- Design elements - Education list blocks | Design elements - List ...
- Design elements - Bulleted and numbered lists | How to Create a ...
- Design elements - Bulleted and numbered lists | Design elements ...
- Design elements - Bulleted and numbered lists | Design elements ...