HelpDesk
How to Plan and Allocate Resources in Your Project on Mac
ConceptDraw PROJECT provides easy ways to project Resources Management: Create a list of project resources and assign the right people to tasks, as well as the necessary materials to be used.HelpDesk
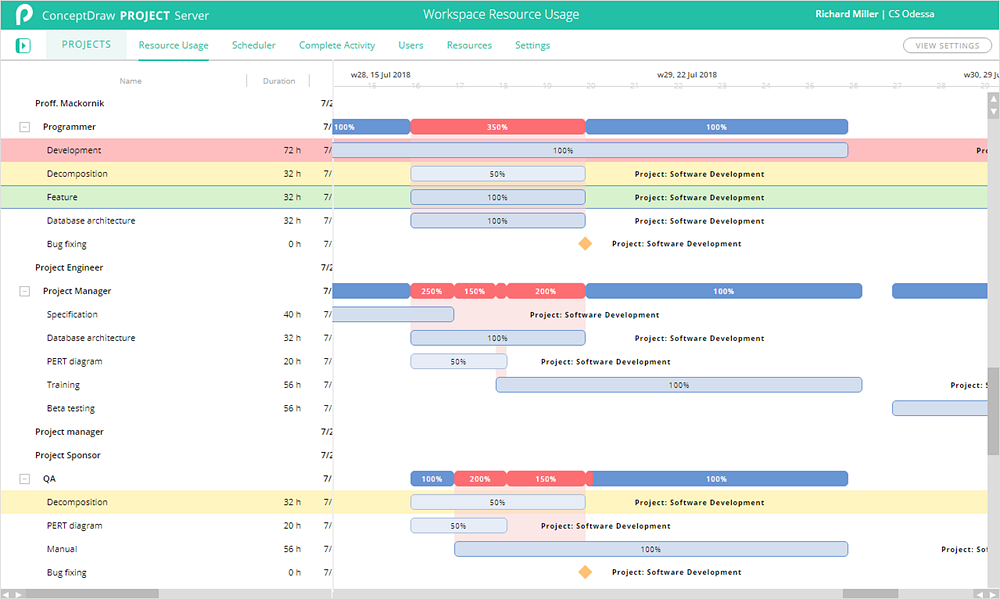
What Information to be Displayed in the ConceptDraw PROJECT Gantt Chart View
What information can can contain the project task list? Gantt Chart view is a graphical representation of a project outline that allows one to allocate tasks.You can customize a project’s tasks list view to include the columns you need to meet your information requirements. The columns of the ConceptDraw PROJECT Gantt view contain the information you want to capture about each task in your project. The following article details what information can be contained in the columns of a project outline.HelpDesk
How to Plan and Allocate Resources with ConceptDraw PROJECT on PC
Effective resource management is a key factor in successful project implementation. The common types of resources for which the project manager has an impact include material resources (materials, energy), staff (work) and equipment. ConceptDraw PROJECT provides easy ways to project Resources Management: Create a list of project resources and assign the right human resource, as well as the necessary material, or equipment to be used.HelpDesk
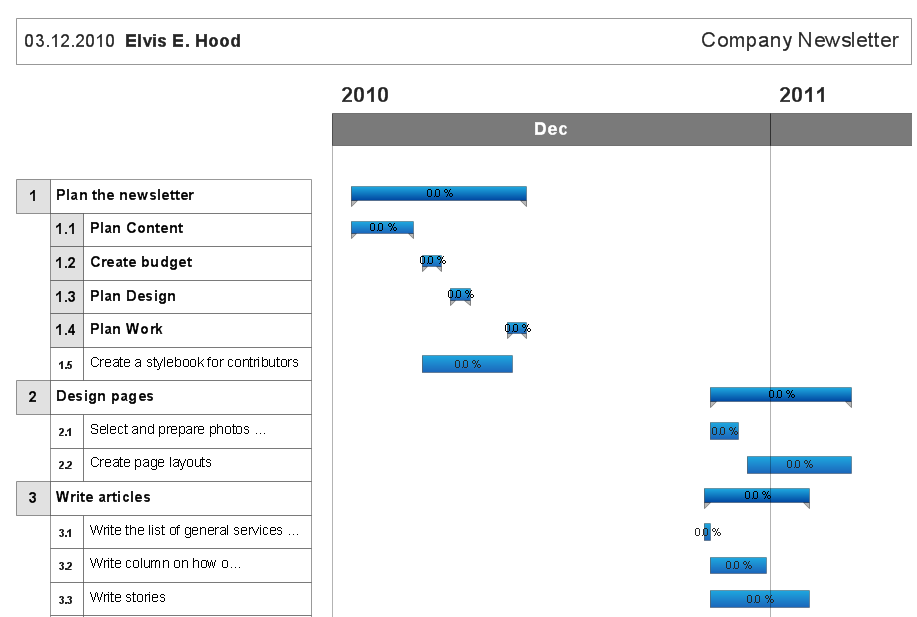
How to Create a Gantt Chart for Your Project
Instruction on how to create Gantt chart using ConceptDraw PROJECT software.Gant Chart is a graphical representation of tasks as segments on a time scale. It helps plan or overlapping.
How to Create Gantt Chart
To begin managing a new project, you will need to define the individual Tasks that must be completed to deliver it. The default view for a new project in ConceptDraw PROJECT is the Gantt Chart.Gantt Chart Diagram
PM Made Easy allows you to plan and execute projects using mind mapping techniques, implement planning using mind mapping, and track tasks using CD Project.HelpDesk
How to Add a Color Marker to Project Task on a Gantt Chart
ConceptDraw PROJECT Server allows adding color markers to scheduled project tasks. A color marker is used to show whether a task is marked for further action or identification of some kind. You can use markers if you want to select certain tasks for further viewing, filtering, formatting, or editing in the offline mode.Program Evaluation and Review Technique (PERT) with ConceptDraw DIAGRAM
PERT Diagram is a more realistic approach of a project's time estimate analysis. After PERT chart was constructed user can discover the shortest possible duration for entire project timescale. The project timeline is the longest chain that might be taken with connected tasks on the PERT Diagram. Completion of serial tasks need to be accomplished in a presented order. At a project timeline can be independent tasks that not linked with main sequence they are called parallel tasks. PERT diagram is more suitable for Critical Path Analysis than Gantt chart for the reason that it undoubtedly better determine task dependencies. Project managers customarily utilize both methodologies.How to Create Presentation of Your Project Gantt Chart
During the planning, discussing and execution of a project you may need to prepare a presentation using project views such as the Gantt Chart, Multiproject Dashboard or Resource Usage View. It’s easy do with ConceptDraw PROJECT!Project — Working With Tasks
A full-featured project management solution with all the necessary functions right at your fingertips. Generates an extensive variety of reports on project and task statuses.These videos provide a series of lessons that will enhance the understanding of all our users, from people just starting out with the software, through to expert users.
- Sample Task Assignment Template
- Task Assignment Table
- WBS Diagram | How to Report Task's Execution with Gantt Chart ...
- Responsibility assignment matrix - Central statistical office | | Work ...
- Project — Task Trees and Dependencies | | Dependency ...
- Gantt Chart Assignment
- Gantt charts for planning and scheduling projects | Gant Chart in ...
- Design elements - Tables | Gantt Chart Software | How to Create ...
- Responsibility Assignment Matrix Example Excel
- Responsibility assignment matrix - Central statistical office | Person ...
- ERD | Entity Relationship Diagrams, ERD Software for Mac and Win
- Flowchart | Basic Flowchart Symbols and Meaning
- Flowchart | Flowchart Design - Symbols, Shapes, Stencils and Icons
- Flowchart | Flow Chart Symbols
- Electrical | Electrical Drawing - Wiring and Circuits Schematics
- Flowchart | Common Flowchart Symbols