This site uses cookies. By continuing to browse the ConceptDraw site you are agreeing to our Use of Site Cookies.

Structured Systems Analysis and Design Method (SSADM) with ConceptDraw DIAGRAM

Structured Systems Analysis and Design Method SSADM is the method which is used at projecting and analysis of information systems. SSADM is based on the data flow diagrams. At the description of data flows out of the system and into the system DFD, which denote boundaries of the system, are used.

Data Flow Diagram

Data flow diagram (DFD) is the part of the SSADM method (Structured Systems Analysis and Design Methodology), intended for analysis and information systems projection. Data flow diagrams are intended for graphical representation of data flows in the information system and for analysis of data processing during the structural projection. Data flow diagram often used in connection with human process and can be displayed as workflow diagram. The critical Process Flow Diagram is another flowchart technique for designing data flow in connection with organizational processes. The critical Process flow diagram may use different range of symbols than a classic workflow diagram.

Context Diagram Template

This template shows the Context Diagram. It was created in ConceptDraw DIAGRAM diagramming and vector drawing software using the Block Diagrams Solution from the “Diagrams” area of ConceptDraw Solution Park.
The context diagram graphically identifies the system. external factors, and relations between them. It’s a high level view of the system. The context diagrams are widely used in software engineering and systems engineering for designing the systems that process the information.

Types of Flowcharts

A Flowchart is a graphically representation of the process, algorithm or the step-by-step solution of the problem. There are ten types of Flowcharts. Using the Flowcharts solution from the Diagrams area of ConceptDraw Solution Park you can easy and quickly design the Flowchart of any of these types.
How to Simplify Flow Charting

JSD - Jackson system development

Jackson System Development (JSD) is a linear method of system development created by Michael A. Jackson and John Cameron in the 1980s. It comprises the whole software life cycle directly or providing a framework for more specialized techniques.
When implementing the Jackson System Development method and designing JSD diagrams, you can succesfully use the powerful and helpful tools of ConceptDraw DIAGRAM software extended with Entity-Relationship Diagram (ERD) solution from the Software Development area of ConceptDraw Solution Park.

Gane Sarson Diagram

The vector stencils library Gane-Sarson Notation from the solution Data Flow Diagrams contains specific symbols of the Gane-Sarson notation such as process symbol, connector symbol, jump symbol for ConceptDraw DIAGRAM diagramming and vector drawing software. The Data Flow Diagrams solution is contained in the Software Development area of ConceptDraw Solution Park.

Pyramid Diagram

A three level pyramid model of different types of Information Systems based on the type of decisions taken at different levels in the organization.

Booch OOD Diagram

The vector stencils library Booch OOD from the solution Software Engineering contains specific symbols of the Booch method such as class symbols, association symbols, aggregation symbols for ConceptDraw DIAGRAM diagramming and vector drawing software. The Software Engineering solution is contained in the Software Development area of ConceptDraw Solution Park.

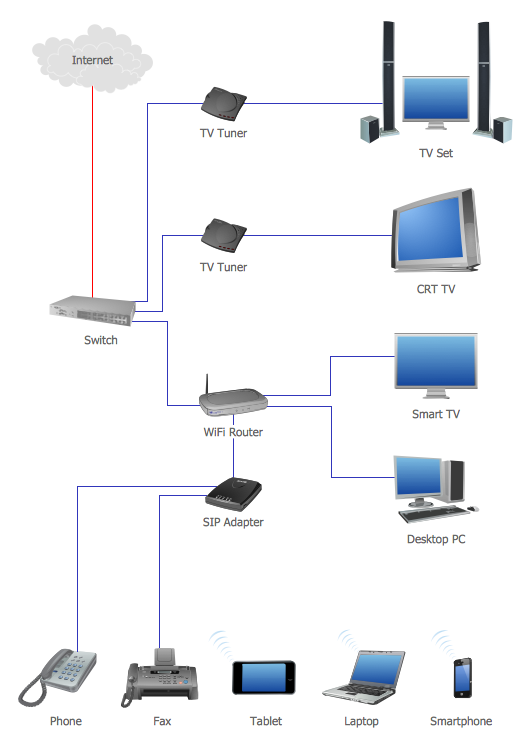
Network Topology Graphical Examples

Computer and Networks solution provides examples, templates and vector stencils library with symbols of local area network (LAN) and wireless LAN (WLAN) equipment.
This example of computer network topology diagram shows home WLAN equipment and their connection to the Internet.

Software Work Flow Process in Project Management with Diagram

This sample was created in ConceptDraw DIAGRAM diagramming and vector drawing software using the Workflow Diagrams Solution from the Software Development area of ConceptDraw Solution Park.

This sample shows the Workflow Diagram that clearly illustrates stages a BPM consists of and relations between all parts of business. The Workflow Diagrams are used to represent the transferring of data during the work process, to study and analysis the working processes, and to optimize a workflow.