Value Stream Mapping Symbols

Business Process Flowchart Symbols

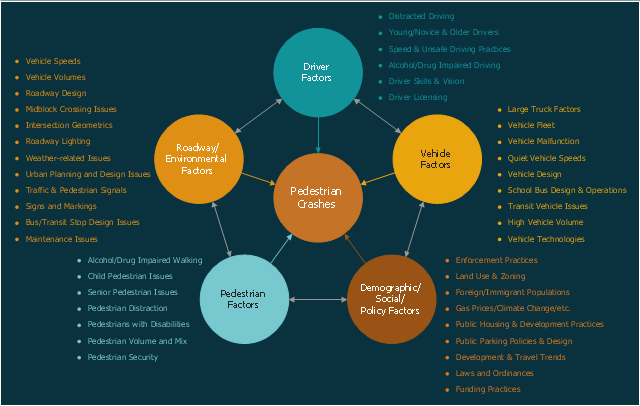
This circle-spoke diagram sample shows the factors related to pedestrian safety and morbidity. It was designed on the base of the figure 3 on the webpage "Pedestrian Safety Strategic Plan: Recommendations for Research and Product Development" from the website of the Federal Highway Administration (FHWA) of the U.S. Department of Transportation (DOT).
"Based on the data analysis and literature review, there are a wide variety of factors which contribute to the likelihood of a pedestrian crash. These include factors related to such categories as pedestrians (e.g., pedestrian age, behavior), drivers (e.g., driver distraction), vehicles (e.g., large trucks), roadway environment (e.g., vehicle speeds and volumes, roadway and intersection design), as well as demographic, social, and policy factors (e.g., land use and zoning practices). Some of the primary factors within each of these five categories are given in Figure 3."
[safety.fhwa.dot.gov/ ped_ bike/ pssp/ fhwasa10035/ ]
The hub-and-spoke diagram example "Factors related to pedestrian safety and morbidity" was created using the ConceptDraw PRO diagramming and vector drawing software extended with the Circle-Spoke Diagrams solution from the area "What is a Diagram" of ConceptDraw Solution Park.
Circle-spoke diagram
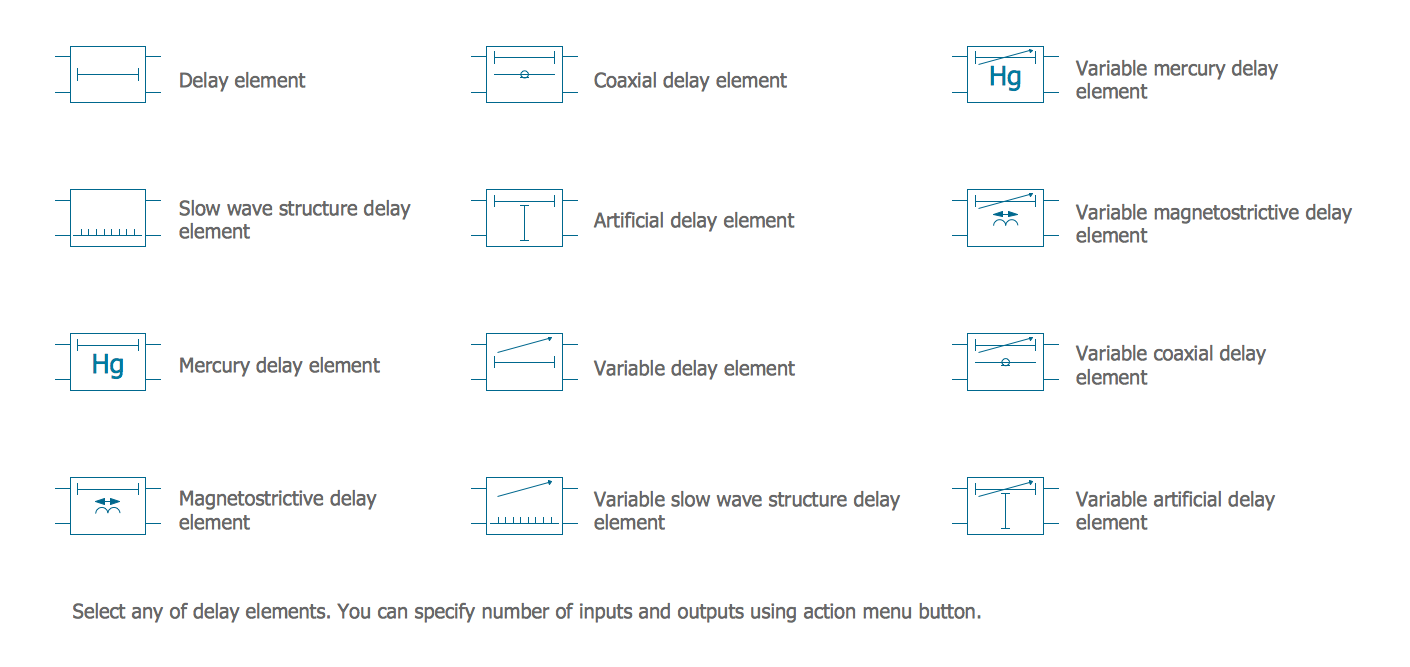
Electrical Symbols — Delay Elements
Human Resource Development

Management Tools — Total Quality Management

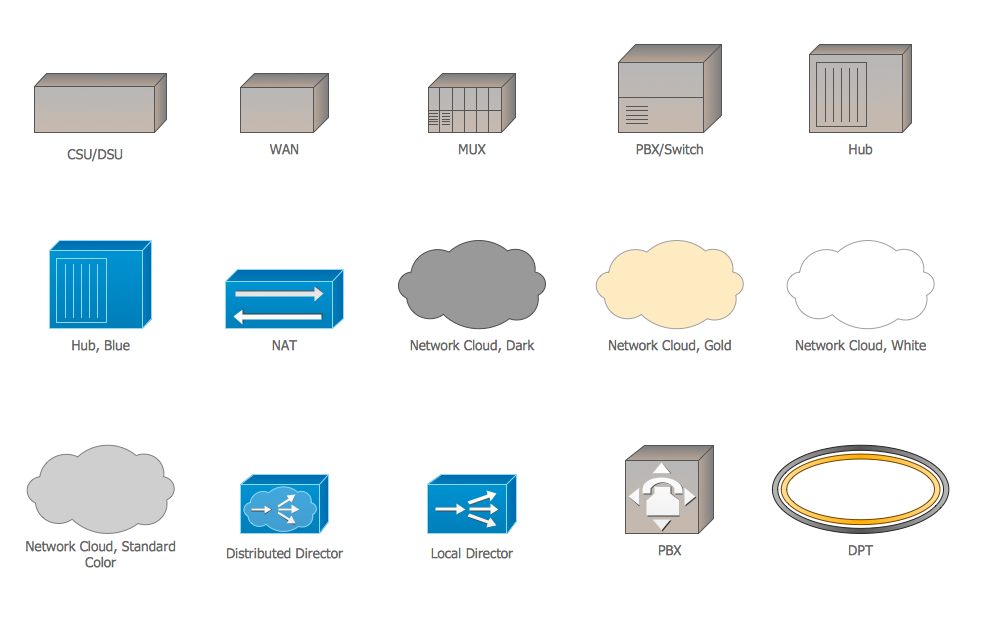
Cisco WAN. Cisco icons, shapes, stencils and symbols
Competitor Analysis

HelpDesk
Accounting Information Systems Flowchart Symbols

Preventive Action


- Swim Lane Flowchart Symbols | PROBLEM ANALYSIS. Identify and ...
- Entity Relationship Diagram Symbols | PROBLEM ANALYSIS ...
- Scale of SWOT factor matrix - Marketing positioning matrices ...
- Swim Lane Diagrams | Swim Lane Flowchart Symbols | Cross ...
- Fta Symbols
- Flow Chart Of A Factor Of Two Numbers
- Flow Chart Common Factor
- Basic Flowchart Symbols and Meaning | Constant improvement of ...
- Accounting Information Systems Flowchart Symbols | In searching of ...