Basic Flowchart Symbols and Meaning
Flowchart Symbols and Meaning - Provides a visual representation of basic flowchart symbols and their proposed use in professional workflow diagram, standard process flow diagram and communicating the structure of a well-developed web site, as well as their correlation in developing on-line instructional projects. See flowchart's symbols by specifics of process flow diagram symbols and workflow diagram symbols.Constant improvement of key performance indicators
There are available tool to lend a fresh look to quality procedures - ConceptDraw MINDMAP.PROBLEM ANALYSIS. Relations Diagram
Use the Relations Diagram to create a relations factors map and to identify which factors are “drivers” and “indicators”. This diagram identifies causal relationships and determine what factors are causes or effects.ConceptDraw OFFICE suite is a software for relation diagram making.
Performance Indicators
ConceptDraw DIAGRAM diagramming and vector drawing software offers the useful tools of the Sales Dashboard solution from the Marketing area for easy creating professional looking live dashboards which allow to track the business sales activity and progress thanks to representing the Key Performance Indicators (KPIs) on them.HelpDesk
How To Create the Interaction (Relations) Diagram
Identify relationships between factors affecting a problem using interaction (relation) diagram. The ability to create a Relation diagram from a mind map is supported by the ConceptDraw Seven Management and Planning Tools solution.TQM Diagram — Professional Total Quality Management
The Total Quality Management Diagram solution helps you and your organization visualize business and industrial processes. Create Total Quality Management diagrams for business process with ConceptDraw software.Relations Diagram
Identify how factors influence each other. Factors mostly influencing called “Drivers” Primarily affected factors called “Indicators”. Problem solving further focuses on changing driver factors by corrective actions. Indicator factors help establish KPI (Key Performance Indicators) to monitor changes and the effectiveness of corrective actions in resolving a problem.Status Dashboard
Status dashboard solution extends ConceptDraw DIAGRAM software with templates, samples and vector stencils libraries with graphic indicators for drawing the visual dashboards showing status data.
Probability Quality Control Tools
The Total Quality Management Diagram solution helps your organization visualize business and industrial processes. Create Total Quality Management diagrams for business process with ConceptDraw software.TQM Diagram Tool
The Total Quality Management Diagram solution helps you and your organization visualize business and industrial processes. Create Total Quality Management diagrams for business process with ConceptDraw software.Business Intelligence Dashboard
Business Intelligence Dashboard solution extends the ConceptDraw DIAGRAM functionality with exclusive tools, numerous ready-to-use vector objects, samples and quick-start templates for creation professional Business Intelligence Dashboards, Business Intelligence Graphics, Business Intelligence Charts and Maps of different kinds. Design easy the BI dashboard, BI model or Dynamic chart in ConceptDraw DIAGRAM to monitor the company's work, to track the indicators corresponding your company's data, to display and analyze key performance indicators, to evaluate the trends and regularities of the processes occurring at the company.
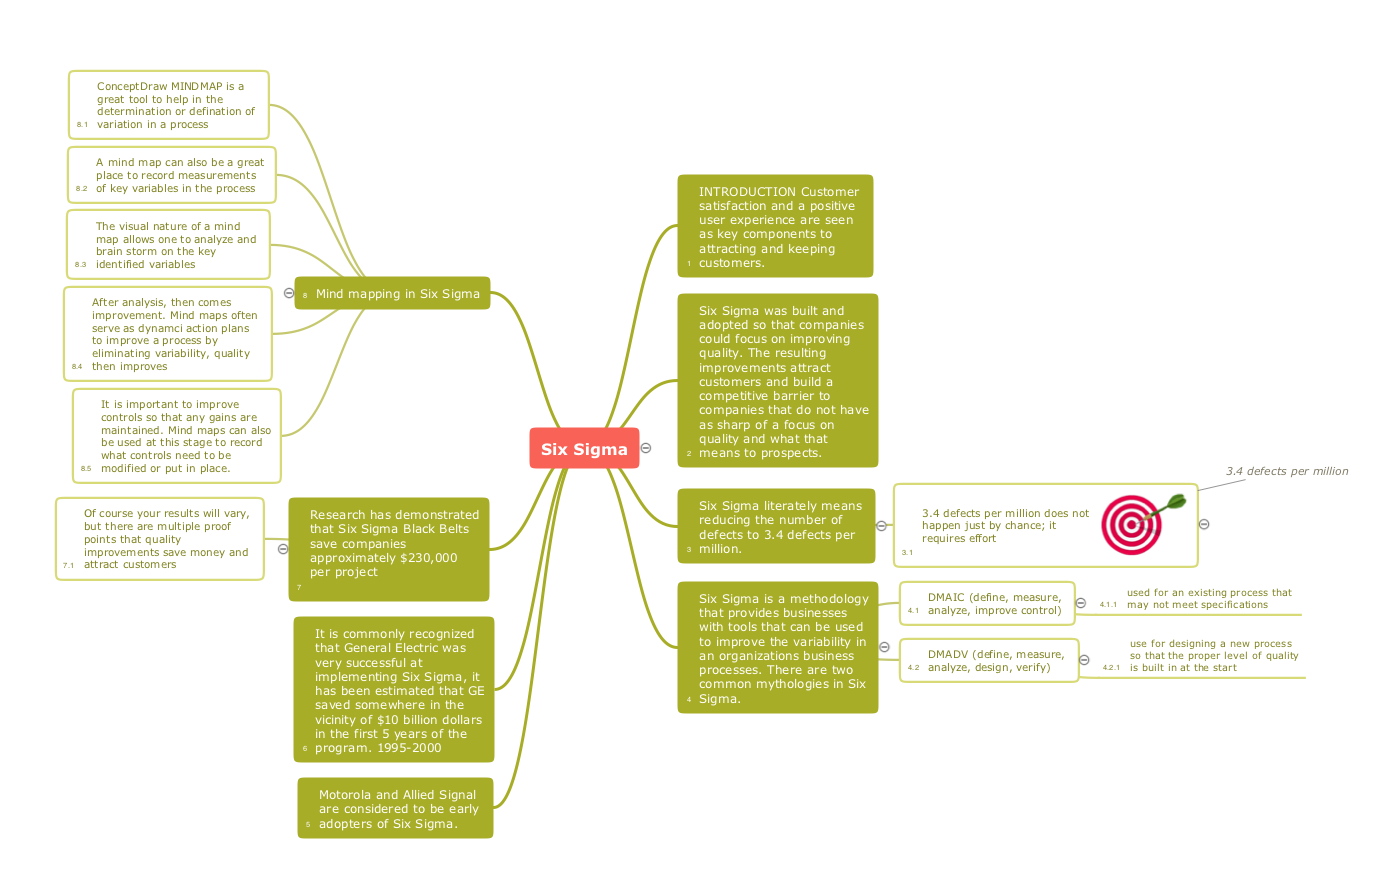
Mind Mapping in the Quality Management
ConceptDraw MINDMAP has a addition to the ConceptDraw Solution Park that provides a creative approach to visualizing quality processes, Quality Mind Map Solution.KPI Dashboard
ConceptDraw DIAGRAM diagramming and vector drawing software supplied with Sales Dashboard solution from the Marketing area of ConceptDraw Solution Park provides the full set of useful tools which make it the best for producing the live KPI Dashboard of any complexity.The Facts and KPIs
Visualizing sales data help you see the facts and KPIs about your sales process to make conclusions and see how your business can improve.- Diagram Business Indicators
- Constant improvement of key performance indicators | Performance ...
- Status Dashboard | TQM Diagram — Professional Total Quality ...
- Diagram That Illustrate All Indicators
- Performance Indicators | BPR Diagram . Business Process ...
- Constant improvement of key performance indicators | TQM Diagram ...
- Performance Indicators | Presentation Exchange | Business Process ...
- Total Quality Management TQM Diagrams | Sales Dashboard ...
- Probability Quality Control Tools | TQM Diagram — Professional ...
- Performance Indicators | Constant improvement of key performance ...
- BPR Diagram . Business Process Reengineering Example | Meter ...
- Process Flowchart | Design elements - Meter indicators | Pyramid ...
- Design elements - Meter indicators | Event-driven Process Chain ...
- PM Dashboards | TQM Diagram — Professional Total Quality ...
- Draw A One Clearly Labelled Diagram To Illustrate All Indicators
- TQM Diagram — Professional Total Quality Management | Constant ...
- Labelled Diagram To Illustrate All Indicators
- Design elements - Meter indicators | Types of Flowcharts | Pyramid ...
- KPIs and Metrics | Business Intelligence Dashboard | The Facts and ...
- ERD | Entity Relationship Diagrams, ERD Software for Mac and Win
- Flowchart | Basic Flowchart Symbols and Meaning
- Flowchart | Flowchart Design - Symbols, Shapes, Stencils and Icons
- Flowchart | Flow Chart Symbols
- Electrical | Electrical Drawing - Wiring and Circuits Schematics
- Flowchart | Common Flowchart Symbols