SWOT Analysis Solution - Strategy Tools

Biology Drawing

Relative Value Chart Software

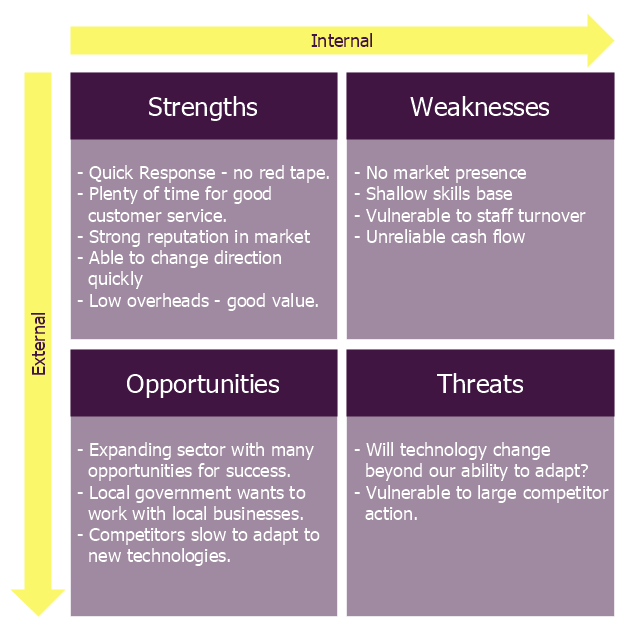
"The name says it: Strength, Weakness, Opportunity, Threat. A SWOT analysis guides you to identify the positives and negatives inside your organization (S-W) and outside of it, in the external environment (O-T). Developing a full awareness of your situation can help with both strategic planning and decision-making.
The SWOT method (which is sometimes called TOWS) was originally developed for business and industry, but it is equally useful in the work of community health and development, education, and even personal growth.
SWOT is not the only assessment technique you can use, but is one with a long track record of effectiveness. The strengths of this method are its simplicity and application to a variety of levels of operation." [ctb.ku.edu/ en/ table-of-contents/ assessment/ assessing-community-needs-and-resources/ swot-analysis/ main]
The diagram example "Small business consultancy SWOT analysis matrix" was created using the ConceptDraw PRO diagramming and vector drawing software extended with the SWOT Analysis solution from the Management area of ConceptDraw Solution Park.
SWOT matrix
Looking at ConceptDraw MINDMAP as a Replacement for Mindjet Mindmanager

Stakeholder Management System

ConceptDraw DIAGRAM

Create Organizational Chart

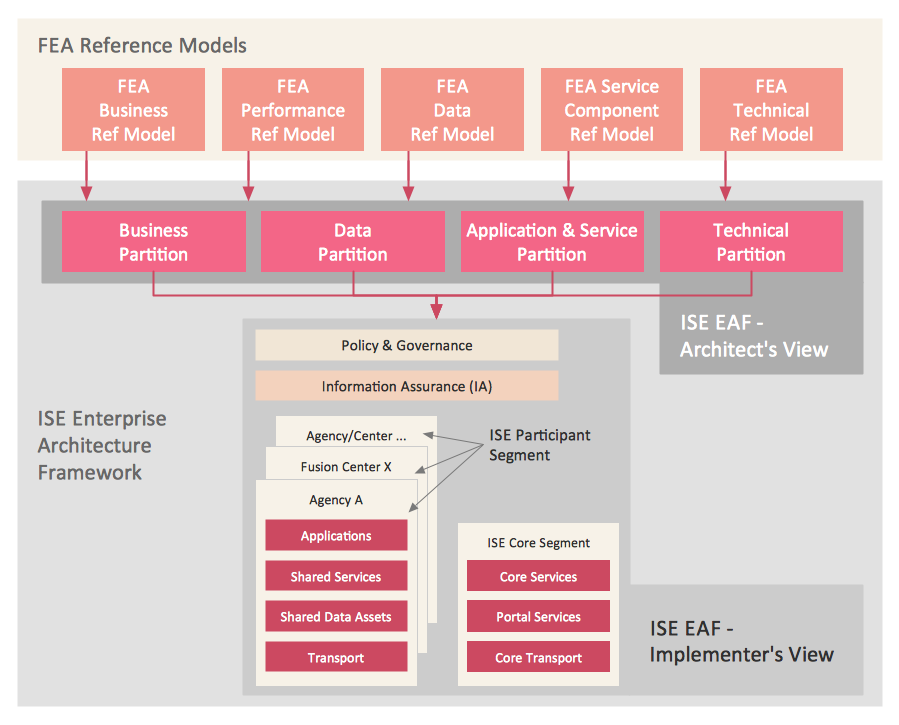
What Is Information Architecture
 Cross-Functional Flowcharts
Cross-functional flowcharts are powerful and useful tool for visualizing and analyzing complex business processes which requires involvement of multiple people, teams or even departments. They let clearly represent a sequence of the process steps, the order of operations, relationships between processes and responsible functional units (such as departments or positions).
 Entity-Relationship Diagram (ERD)
An Entity-Relationship Diagram (ERD) is a visual presentation of entities and relationships. That type of diagrams is often used in the semi-structured or unstructured data in databases and information systems. At first glance ERD is similar to a flowch
 Bubble Diagrams
Bubble diagrams have enjoyed great success in software engineering, architecture, economics, medicine, landscape design, scientific and educational process, for ideas organization during brainstorming, for making business illustrations, presentations, planning, design, and strategy development. They are popular because of their simplicity and their powerful visual communication attributes.
 Computer Network Diagrams
Computer Network Diagrams solution extends ConceptDraw DIAGRAM software with samples, templates and libraries of vector icons and objects of computer network devices and network components to help you create professional-looking Computer Network Diagrams, to plan simple home networks and complex computer network configurations for large buildings, to represent their schemes in a comprehensible graphical view, to document computer networks configurations, to depict the interactions between network's components, the used protocols and topologies, to represent physical and logical network structures, to compare visually different topologies and to depict their combinations, to represent in details the network structure with help of schemes, to study and analyze the network configurations, to communicate effectively to engineers, stakeholders and end-users, to track network working and troubleshoot, if necessary.
HelpDesk
How to Create a Stakeholder Onion Diagram

 Entity-Relationship Diagram (ERD)
Entity-Relationship Diagram (ERD) solution extends ConceptDraw DIAGRAM software with templates, samples and libraries of vector stencils from drawing the ER-diagrams by Chen's and crow’s foot notations.
- Swot Analysis Ppt For Students
- How to Create a PowerPoint Presentation from a SWOT Analysis ...
- Ppt On Swot Analysis Of Student
- Personal Swot Analysis Examples For Students
- Samples Of Students Swot Analysis
- Ppt Swot Strength Weakness Ppt For Student
- Student Swot Analysis Ppt
- How to Create a PowerPoint Presentation from a SWOT Analysis ...
- Swot Analysis Matrix Of Self Student
- A Power Point Presentation Of Swot Analysis Of A Student
- Swot Analysis For Students In College Ppt
- SWOT Analysis | SWOT Sample in Computers | SWOT Analysis ...
- How to Create a PowerPoint Presentation from a SWOT Analysis ...
- Sample Swot Analysis By College Students
- SWOT Analysis | How to Create Presentation of Your Project Gantt ...
- Sample Of Swot Analysis Of Student
- Swot Analysis Of Self Student Example
- Ppt For Mechanical Engineering Student For Presentation
- Threats In Swot Analysis For Students
- SWOT analysis for a small independent bookstore | SWOT Analysis ...