SWOT Analysis Solution - Strategy Tools

Looking at ConceptDraw MINDMAP as a Replacement for Mindjet Mindmanager

Relative Value Chart Software

Biology Drawing

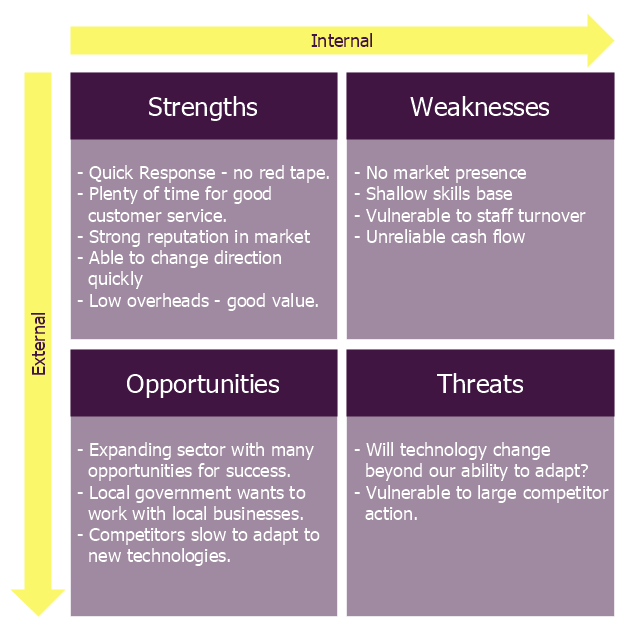
"The name says it: Strength, Weakness, Opportunity, Threat. A SWOT analysis guides you to identify the positives and negatives inside your organization (S-W) and outside of it, in the external environment (O-T). Developing a full awareness of your situation can help with both strategic planning and decision-making.
The SWOT method (which is sometimes called TOWS) was originally developed for business and industry, but it is equally useful in the work of community health and development, education, and even personal growth.
SWOT is not the only assessment technique you can use, but is one with a long track record of effectiveness. The strengths of this method are its simplicity and application to a variety of levels of operation." [ctb.ku.edu/ en/ table-of-contents/ assessment/ assessing-community-needs-and-resources/ swot-analysis/ main]
The diagram example "Small business consultancy SWOT analysis matrix" was created using the ConceptDraw PRO diagramming and vector drawing software extended with the SWOT Analysis solution from the Management area of ConceptDraw Solution Park.
SWOT matrix
ConceptDraw DIAGRAM

 Entity-Relationship Diagram (ERD)
An Entity-Relationship Diagram (ERD) is a visual presentation of entities and relationships. That type of diagrams is often used in the semi-structured or unstructured data in databases and information systems. At first glance ERD is similar to a flowch
What Is Information Architecture
 Event-driven Process Chain Diagrams
Event-Driven Process Chain Diagrams solution extends ConceptDraw DIAGRAM functionality with event driven process chain templates, samples of EPC engineering and modeling the business processes, and a vector shape library for drawing the EPC diagrams and EPC flowcharts of any complexity. It is one of EPC IT solutions that assist the marketing experts, business specialists, engineers, educators and researchers in resources planning and improving the business processes using the EPC flowchart or EPC diagram. Use the EPC solutions tools to construct the chain of events and functions, to illustrate the structure of a business process control flow, to describe people and tasks for execution the business processes, to identify the inefficient businesses processes and measures required to make them efficient.
 School and Training Plans
School and Training Plans solution enhances ConceptDraw DIAGRAM functionality with extensive drawing tools, numerous samples and examples, templates and libraries of classroom design elements for quick and professional drawing the School and Training plans, School Floor plans, Classroom Layout, Classroom Seating chart, Lecture Room plans of any complexity. Each offered classroom seating chart template is a real help for builders, designers, engineers, constructors, as well as teaching personnel and other teaching-related people in drawing Classroom Seating charts and Training Room layouts with ConceptDraw DIAGRAM classroom seating chart maker.
 Entity-Relationship Diagram (ERD)
Entity-Relationship Diagram (ERD) solution extends ConceptDraw DIAGRAM software with templates, samples and libraries of vector stencils from drawing the ER-diagrams by Chen's and crow’s foot notations.
 Bar Graphs
The Bar Graphs solution enhances ConceptDraw DIAGRAM functionality with templates, numerous professional-looking samples, and a library of vector stencils for drawing different types of Bar Graphs, such as Simple Bar Graph, Double Bar Graph, Divided Bar Graph, Horizontal Bar Graph, Vertical Bar Graph, and Column Bar Chart.
 Area Charts
Area Charts are used to display the cumulative totals over time using numbers or percentages; or to show trends over time among related attributes. The Area Chart is effective when comparing two or more quantities. Each series of data is typically represented with a different color, the use of color transparency in an object’s transparency shows overlapped areas and smaller areas hidden behind larger areas.
 Mechanical Engineering
This solution extends ConceptDraw DIAGRAM.9 mechanical drawing software (or later) with samples of mechanical drawing symbols, templates and libraries of design elements, for help when drafting mechanical engineering drawings, or parts, assembly, pneumatic,
- Swot Analysis Ppt For Students
- Ppt On Swot Analysis For Students
- Samples Of Students Swot Analysis
- Swot Analysis For Good Students Ppt
- Examples Of Swot Analysis For Students
- Personal Swot Analysis Examples For Students
- Swot Analysis Of Students
- Swot Analysis Of Student At Project Work
- Swot Analysis Of A Student Ppt
- Swot Analysis For Student
- SWOT Analysis Solution - Strategy Tools | Entity-Relationship ...
- Example Work Of Swot Analysis For Students
- Swot Analysis Student Diagram
- Swot Analysis Examples for Mac OSX | SWOT analysis Software ...
- SWOT Analysis | How to Create SWOT Analysis Template Using ...
- How to Create SWOT Analysis Template Using ConceptDraw PRO ...
- Swot Analysis On Yourself Example For University Students
- Simple Swot Example For A Student
- SWOT Analysis | SWOT and TOWS Matrix Diagrams | SWOT ...