This SWOT matrix diagram example was created on the base of article "An Easy Way To Jumpstart Your Strategic Plan: SWOT" by Leslie Wolf from the website of the California Digital Library, the University of California. "Strategic planning doesn’t have to be a daunting and lengthy process. The goal is really a simple one: to help you understand your world and build a road map to guide your efforts. ...
This analysis tool can help you focus your attention on the specific success factors that are right for your team.
The tool is called a SWOT analysis. SWOT stands for Strengths and Weaknesses, Opportunities and Threats. Here’s what it means:
(1) Strengths are those positive internal attributes that strengthen your business or team. You can develop plans to capitalize on those strengths.
(2) Weaknesses are those negative internal attributes that are working against your success. You can shore up those weaknesses so they don’t stop your success.
(3) Opportunities are those external conditions that can have a positive effect on your goals. These opportunities can point you in the right direction.
(4) Threats are those external conditions that can have a negative effect on your goals. These threats will affect you less if you can identify and minimize them. ...
We thought it would be helpful to show you a sample SWOT analysis for a business you can easily visualize: a small independent bookstore in a university town. The store owner brought the team together to think about how the bookstore could survive during the continuing financial downturn. After an hour of brainstorming, this is the SWOT analysis they developed." [cdlib.org/ cdlinfo/ 2010/ 09/ 29/ an-easy-way-to-jumpstart-your-strategic-plan-swot/ ]
The matrix diagram example "SWOT analysis for a small independent bookstore" was created using the ConceptDraw PRO diagramming and vector drawing software extended with the SWOT Analysis solution from the Management area of ConceptDraw Solution Park.
SWOT Analysis
Most of the data needed for market analysis (demand, prices, volume of sales, etc.) are undefined, and in future are possible their changes as in the worst and the best side. SWOT analysis is effective method for prediction these processes and decision making for organizations that function in a competitive environment. It allows you to see the whole situation, to identify the strengths and weaknesses of organization (advantages and disadvantages), as well as opportunities and threats of external environment. The results of SWOT analysis are the basis for optimization the business processes, for development by the leading specialists in organization of interrelated complex of strategies and competitive activities. ConceptDraw DIAGRAM software enhanced with SWOT and TOWS Matrix Diagrams Solution will effectively help you in strategic planning for your company, department, project, in development marketing campaign, in identification of four categories of factors of internal and external environment of organization, and construction professional-looking SWOT and TOWS matrices.Business Process Elements: Events
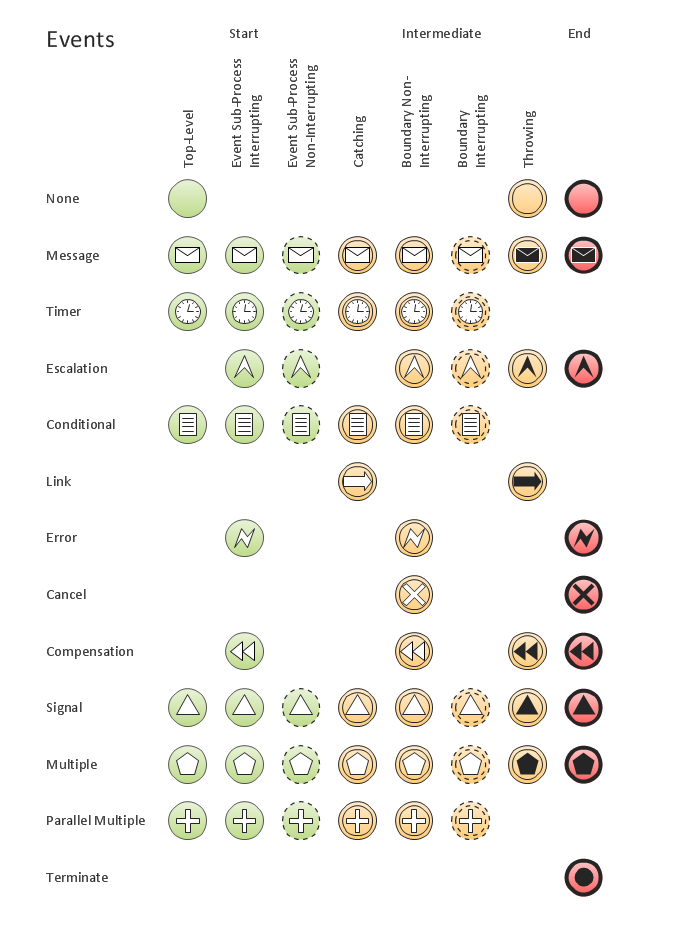
Create professional business process diagrams using ConceptDraw Events library with 17 objects from BPMN.
 SWOT and TOWS Matrix Diagrams
SWOT and TOWS Matrix Diagrams solution extends ConceptDraw DIAGRAM and ConceptDraw MINDMAP software with features, templates, samples and libraries of vector stencils for drawing SWOT and TOWS analysis matrices and mind maps.
Growth-Share Matrix Software
Growth-Share Matrix Software - ConceptDraw DIAGRAM is a powerful diagramming and vector drawing software for creating professional looking Growth–Share Matrices. For simple and quick creating the Growth–Share Matrix ConceptDraw DIAGRAM offers the Matrices Solution from the Marketing Area of ConceptDraw Solution Park. The Matrices Solution also provides a wide variety of templates and samples that will help you to create the Matrix diagrams of any difficulty.Think. Act. Accomplish.
ConceptDraw MINDMAP is ready to provide you with mind mapping tool which can serve as comprehensive productivity tool for your business.PERT Chart Software
PERT Chart Software - Activity Network and Project Evaluation and Review Technique, or PERT, charts are a way of documenting and analyzing the tasks in a project. ConceptDraw DIAGRAM is a powerful diagramming and vector drawing software for designing professional looking PERT Charts quick and easy.Competitor Analysis
Competitor analysis is a first and obligatory step in elaboration the proper corporate marketing strategy and creating sustainable competitive advantage. Use powerful opportunities of numerous solutions from ConceptDraw Solution Park for designing illustrative diagrams, charts, matrices which are necessary for effective competitor analysis.Prioritization Matrix
You can design the Prioritization Matrix by hand on the paper, but we offer you the most easier way - to use the ConceptDraw DIAGRAM diagramming and vector drawing software extended with Seven Management and Planning Tools Solution from the Management Area.
 Management Area
The solutions from Management area of ConceptDraw Solution Park collect templates, samples and libraries of vector stencils for drawing the management diagrams and mind maps.
VSM
Value stream mapping is a lean-management method for analyzing the current state and designing a future state for the series of events that take a product or service from its beginning through to the customer. ConceptDraw DIAGRAM diagramming and vector drawing software extended with Value Stream Mapping solution from the Quality area of ConceptDraw Solution Park is effective for implementation a value stream mapping (VSM) process and for creating Value Stream Maps.Winter Sports Vector Clipart. Medal Map. Spatial Infographics
Tracking Olympic results in visual format is the most modern way to deliver statistics to a broad audience. This is a good example of an illustrated table you may easily modify, print, or publish on web from ConceptDraw Winter Sports solution.Fire Exit Plan
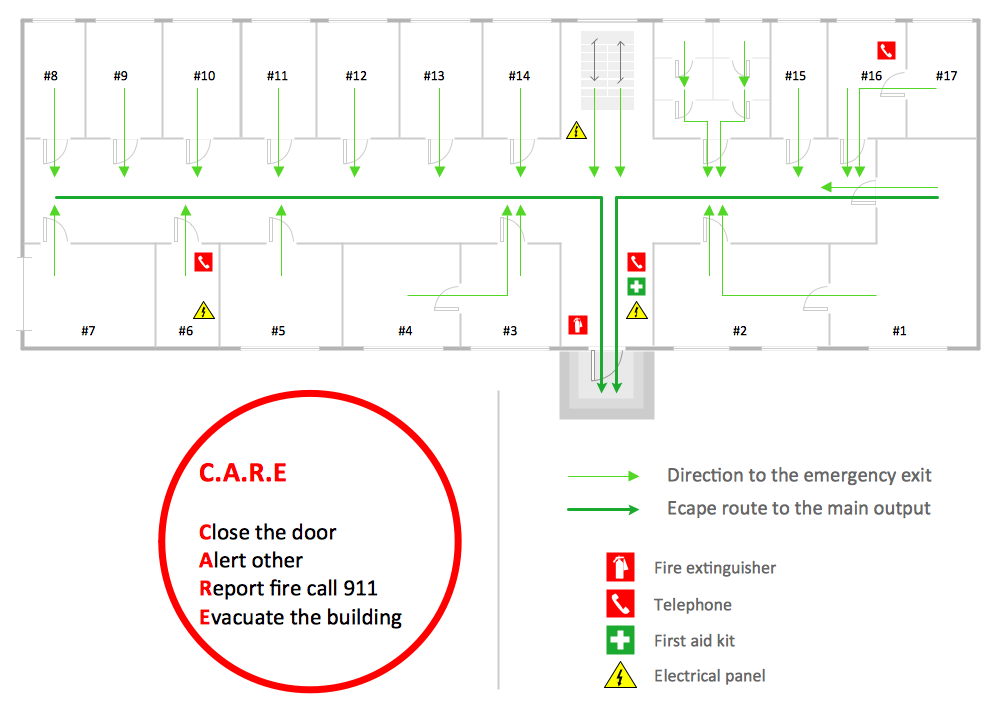
ConceptDraw DIAGRAM extended with Fire and Emergency Plans solution from the Building Plans area of ConceptDraw Solution Park lets you make a Fire Exit Plan of any complexity in minutes.Flowchart of Products. Flowchart Examples
This sample shows the Flowchart of the Sustainment and Disposal. A Flowchart is a graphically representation of the process that step-by-step lead to the solution the problem. The geometric figures on the Flowchart represent the steps of the process and are connected with arrows that show the sequence of the actions. The Flowcharts are widely used in engineering, architecture, science, analytics, government, politics, business, marketing, manufacturing, administration, etc.HelpDesk
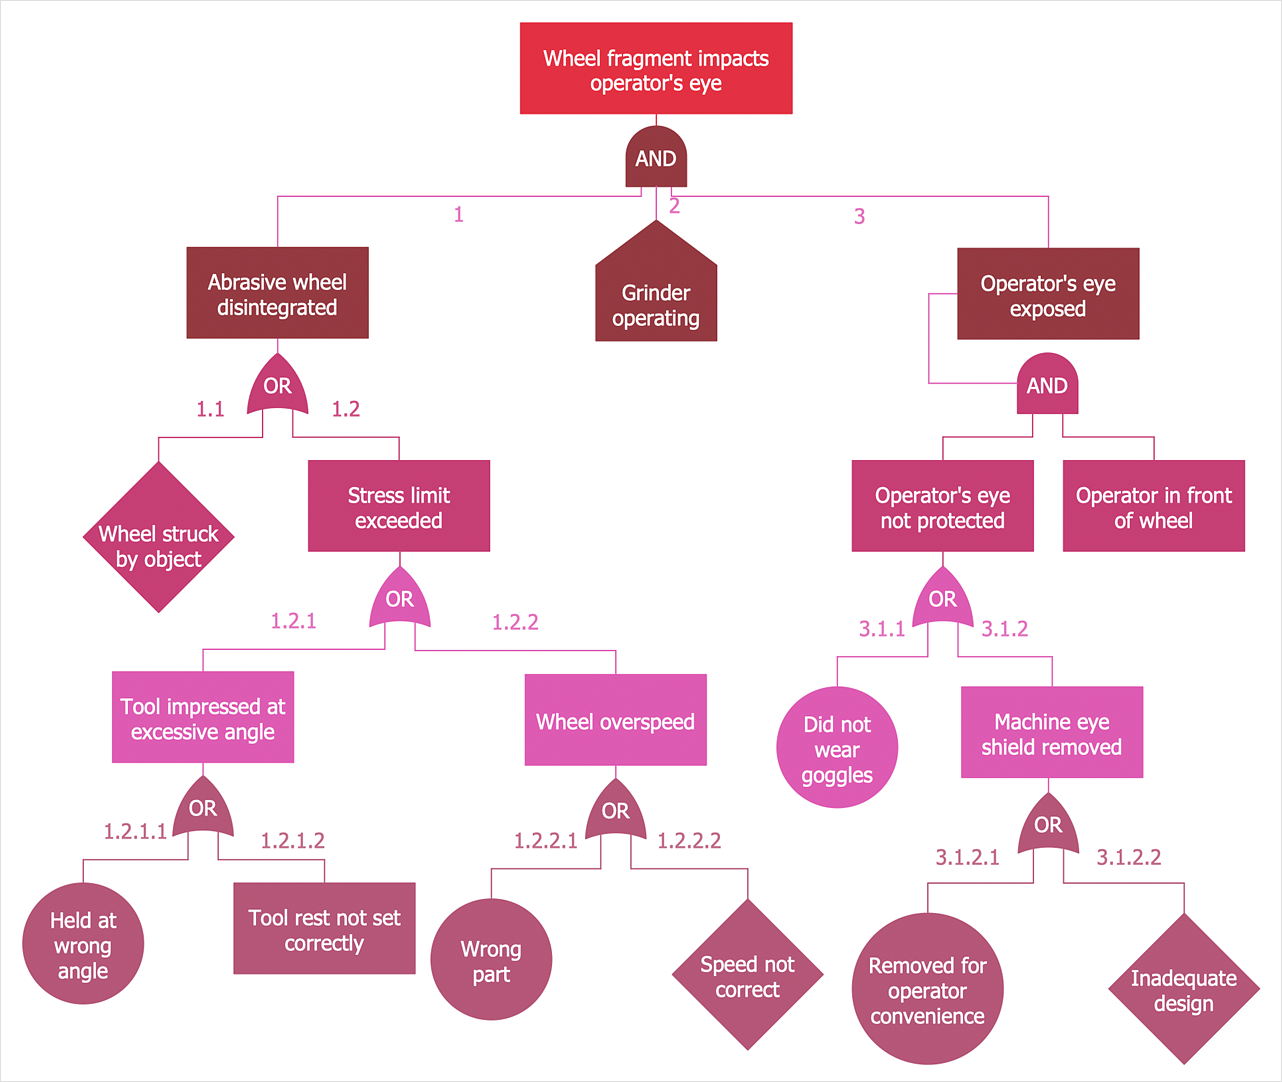
How to Create a Fault Tree Analysis Diagram (FTD)
Fault Tree Diagram is a logic diagram that shows the state of an entire system in a relationship of the conditions of its elements. Fault Tree Diagram is used to analyze the probability of functional system failures and safety accidents. ConceptDraw DIAGRAM allows you to create professional Fault Tree Diagrams using the basic FTD symbols. An FTD visualizes a model of the processes within a system that can lead to the unlikely event. A fault tree diagrams are created using standard logic symbols. The basic elements in a fault tree diagram are gates and events.- Swot Analysis For Event Planning Business
- Swot Analysis Example For Event
- Swot Analysis Example Event Place
- Fishbone Diagrams | Fishbone Diagram Problem Solving | SWOT ...
- SWOT Analysis | Growth-Share Matrix Software | Prioritization Matrix ...
- Critical Path Event Planning
- Sign Making Software | Flyer Templates | SWOT Analysis | Free ...
- Conference Planning Software | Conference Planning | Presenting a ...
- Event Planning Process
- Event Planning Flow Chart
- SWOT and TOWS Matrix Diagrams | Basic Circle-Spoke Diagrams ...
- SWOT Analysis | Activity Network Diagram Method | Process ...
- PROBLEM ANALYSIS . Prioritization Matrix | PROBLEM ANALYSIS ...
- SWOT Analysis | SWOT Matrix Template | Fault Tree Analysis ...
- Ansoff Matrix | Matrices | Competitor Analysis | Market Growth Example
- Activity Network Diagram Method | SWOT Analysis | Human ...
- SWOT Template | TOWS Analysis | TOWS Analysis Software | Swot ...
- Dfd For Online Event Planning Organisations
- SWOT Analysis | SWOT Analysis | Small business consultancy ...
- Flowchart Example: Flow Chart of Marketing Analysis | Competitor ...


