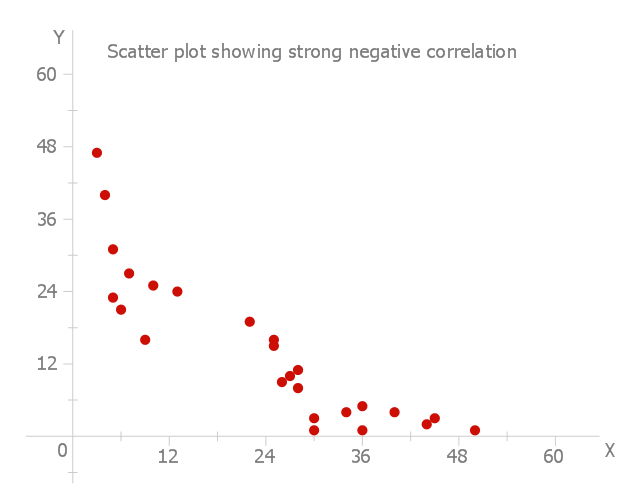
This scatter graph sample shows the strong negative correlation. It was designed on the base of the Wikimedia Commons file: Scatter plot showing strong negative correlation. 02.jpg.
[commons.wikimedia.org/ wiki/ File:Scatter_ plot_ showing_ strong_ negative_ correlation._ 02.jpg]
This file is licensed under the Creative Commons Attribution-Share Alike 4.0 International license. [creativecommons.org/ licenses/ by-sa/ 4.0/ deed.en]
"A scatter plot can suggest various kinds of correlations between variables with a certain confidence interval. For example, weight and height, weight would be on y axis and height would be on the x axis. Correlations may be positive (rising), negative (falling), or null (uncorrelated). If the pattern of dots slopes from lower left to upper right, it indicates a positive correlation between the variables being studied. If the pattern of dots slopes from upper left to lower right, it indicates a negative correlation." [Scatter plot. Wikipedia]
The scatter plot example "Strong negative correlation" was created using ConceptDraw PRO software extended with the Scatter Diagrams solution from the Statistical Charts and Diagrams area of ConceptDraw Solution Park.
Scatter plot
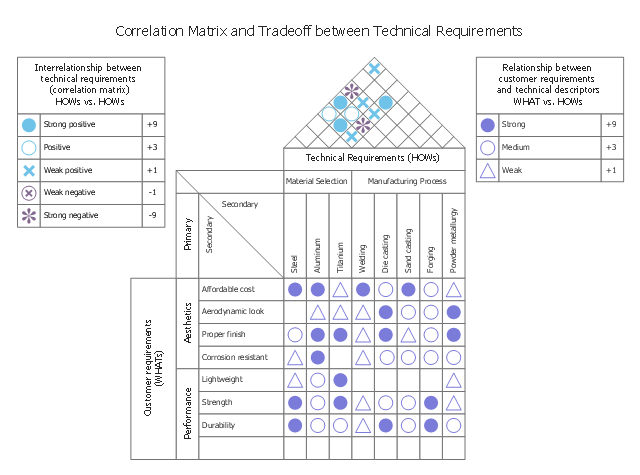
This house of quality sample illustrates correlation matrix.
It was designed on the base of the figure 3-5 in Lecture "How QFD helps in product quality improvement?" from the website of National Programme on Technology Enhanced Learning (NPTEL), India. [nptel.ac.in/ courses/ 110101010/ downloads/ mod3/ Module%20 III-Lec1.pdf]
Distributed under Creative Commons Attribution-ShareAlike 4.0 International (CC BY-SA 4.0) [creativecommons.org/ licenses/ by-sa/ 4.0/ ]
"After drafting the relationship matrix, it is evaluated for any empty row or column. An empty row indicates that a customer voice is not being addressed by any technical descriptors. Thus, the customer expectation is not being met. Any blank column indicates that the technical requirement is unnecessary, as it does not address any VOC.
The roof of the house of quality, expressed as correlation matrix, is used to identify any interrelationships between the technical descriptors (Figure 3-5). Symbols are used to describe the strength of the interrelationships. Symbols generally preferred are:
- A ‘solid circle’ represents a strong positive relationship.
- A ‘circle’ represents a positive relationship.
- An ‘X’ represents a negative relationship.
- An ‘asterisk’ represents a strong negative relationship." [nptel.ac.in/ courses/ 110101010/ modules/ module3/ lec1/ 1.7.html]
The HOQ example "House of Quality - correlation matrix" was designed using ConceptDraw PRO software extended with House of Quality solution from Quality area of ConceptDraw PRO Solution Park.
HOQ of a handlebar stem in a bicycle
 Scatter Diagrams
The Scatter Diagrams solution extends ConceptDraw DIAGRAM functionality with templates, samples, and a library of vector stencils that make construction of a Scatter Plot easy. The Scatter Chart Solution makes it easy to design attractive Scatter Diagrams used in various fields of science, work, and life activities. ConceptDraw DIAGRAM lets you enter the data to the table and construct the Scatter Plot Graph automatically according to these data.
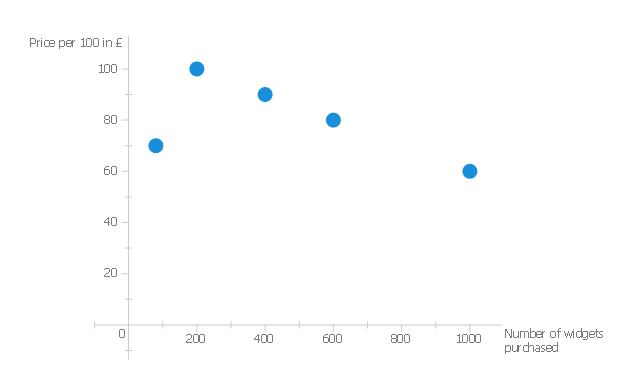
This scatter graph sample shows the correlation of widget price and number of widgets purchased.
"Correlation.
Correlation measures the strength of association between two variables. We will first consider the relationship between two scalar variables and then between ranked variables.
Pearson correlation coefficient.
Pearson's R indicates the strength and direction of association between two scalar variables, ranging from -1 which indicates a strong inverse relationship and 1 indicating a strong direct relationship. At 0 we say there is no correlation; it measures the linear dependence of one variable on another. Linear dependence means that one variable can be computed from the other by a linear equation ...
An inverse correlation.
In the following data we see that as the number of widgets rises, the price per 100 widgets falls. This is an inverse correlation and has a negative value for Pearson's R. ...
For this data the correlation coefficient has a value of -1." [en.wikibooks.org/ wiki/ Statistics_ Ground_ Zero/ Association]
The scatter chart example "Widget price correlation" was created using the ConceptDraw PRO diagramming and vector drawing software extended with the Basic Scatter Diagrams solution from the Graphs and Charts area of ConceptDraw Solution Park.
Scattergraph
 House of Quality
House of Quality solution provides the powerful drawing tools, numerous specific samples and examples, and set of vector design elements of House of Quality shapes and symbols, which will help you in application the Quality function deployment (QFD) methodology and in easy creation the House of Quality Matrices intended for satisfaction the consumers' desires and requirements, for representing them in a visual way and then transformation into the targets and technical requirements to be followed for development the best products.
Product Planning

 Healthcare Management Workflow Diagrams
Healthcare Management Workflow Diagrams solution contains large set of colorful samples and libraries with predesigned vector pictograms and symbols of health, healthcare equipment, medical instruments, pharmaceutical tools, transport, medication, departments of healthcare organizations, the medical icons of people and human anatomy, as well as the predesigned flowchart objects, connectors and arrows, which make it the best for designing clear and comprehensive Medi?al Workflow Diagrams and Block Diagrams, Healthcare Management Flowcharts and Infographics, Healthcare Workflow Diagram, for depicting the healthcare workflow and clinical workflows in healthcare, for making the workflow analysis healthcare and healthcare workflow management.
- House of Quality - correlation matrix | House of Quality - customer's ...
- House of Quality - correlation matrix | House of Quality ...
- Design elements - HOQ symbols | HOQ | HOQ matrix - Template | Hoq
- House of Quality | Customer types matrix | Product Planning ...
- House of Quality | House of Quality Matrix Software | How to Create ...
- House of Quality | How to Create a House of Quality Diagram ...
- Electrical Symbols — Power Sources | Electrical Symbols ...
- Mechanical Drawing Symbols | Cisco Switches and Hubs. Cisco ...
- Total value of manufacturers' shipments | Widget price correlation ...
- Design elements - Scatter graphs | Scatter graphs - Vector stencils ...
- 2^x Function graph | Seven Basic Tools of Quality | Line Chart ...
- ERD | Entity Relationship Diagrams, ERD Software for Mac and Win
- Flowchart | Basic Flowchart Symbols and Meaning
- Flowchart | Flowchart Design - Symbols, Shapes, Stencils and Icons
- Flowchart | Flow Chart Symbols
- Electrical | Electrical Drawing - Wiring and Circuits Schematics
- Flowchart | Common Flowchart Symbols
- Flowchart | Common Flowchart Symbols