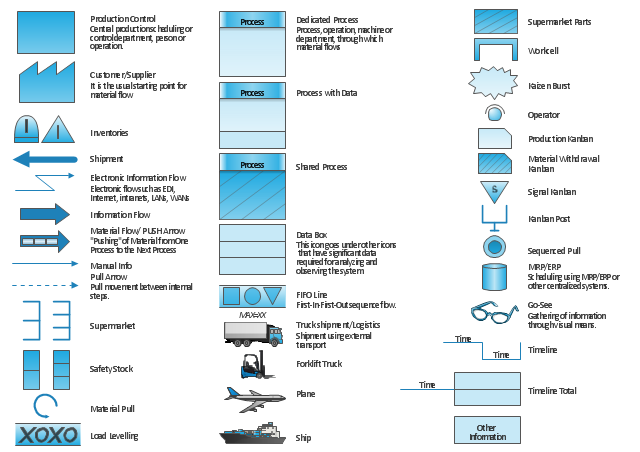
Value Stream Mapping Symbols

"Value stream mapping usually employs standard symbols to represent items and processes, therefore knowledge of these symbols is essential to correctly interpret the production system problems." [Value stream mapping. Wikipedia]
The vector stencils library Value stream mapping contains 43 symbols for drawing the value stream mapping diagrams using the ConceptDraw PRO diagramming and vector drawing software.
The example "Design elements - Value stream mapping diagram" is included in the Value Stream Mapping solution from the Quality area of ConceptDraw Solution Park.
VSM symbols
Best Value Stream Mapping mac Software
 diagram")
Value-Stream Mapping for Manufacturing
")
Lean Manufacturing Diagrams
 design elements")
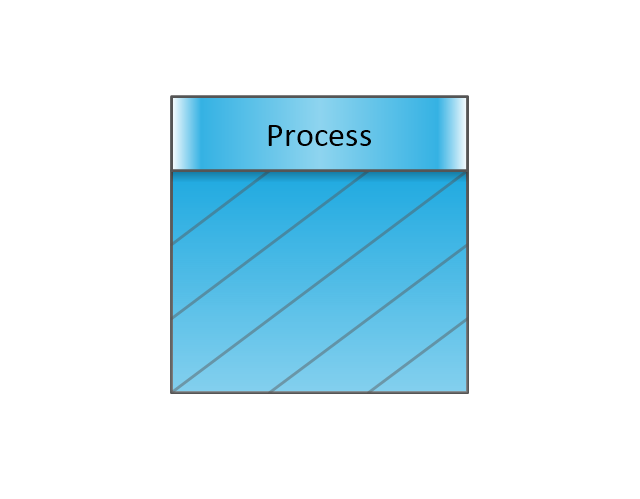
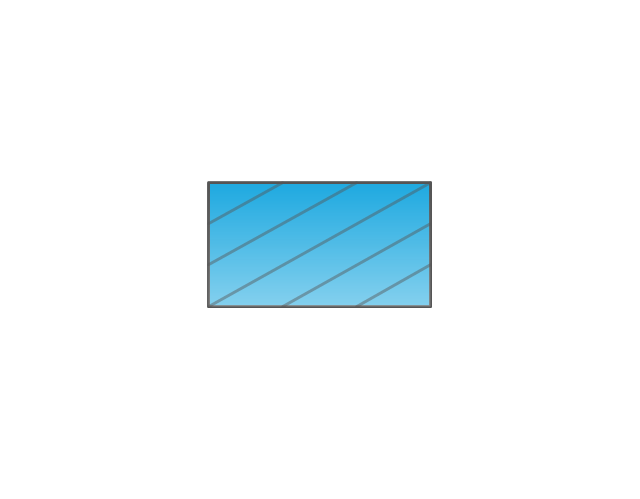
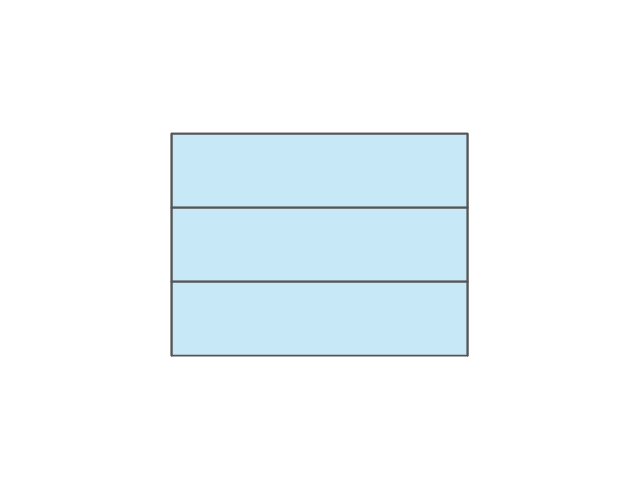
The vector stencils library "Value stream mapping" contains 43 VSM symbols.
Use it for drawing value stream maps in the ConceptDraw PRO diagramming and vector drawing software extended with the Value Stream Mapping solution from the Quality area of ConceptDraw Solution Park.
www.conceptdraw.com/ solution-park/ business-value-stream-mapping
Use it for drawing value stream maps in the ConceptDraw PRO diagramming and vector drawing software extended with the Value Stream Mapping solution from the Quality area of ConceptDraw Solution Park.
www.conceptdraw.com/ solution-park/ business-value-stream-mapping
Inventory
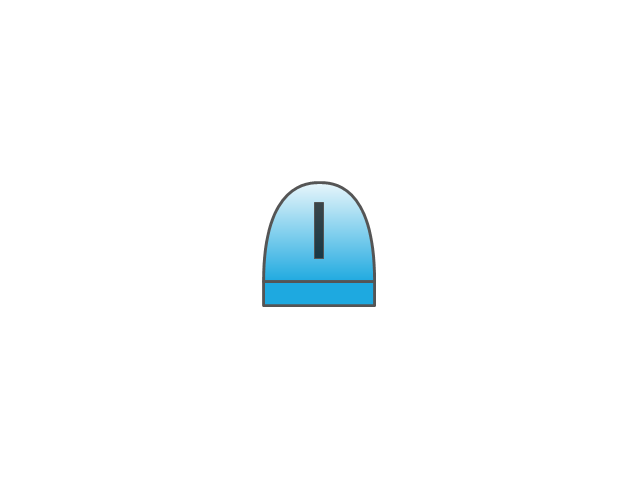
Inventory

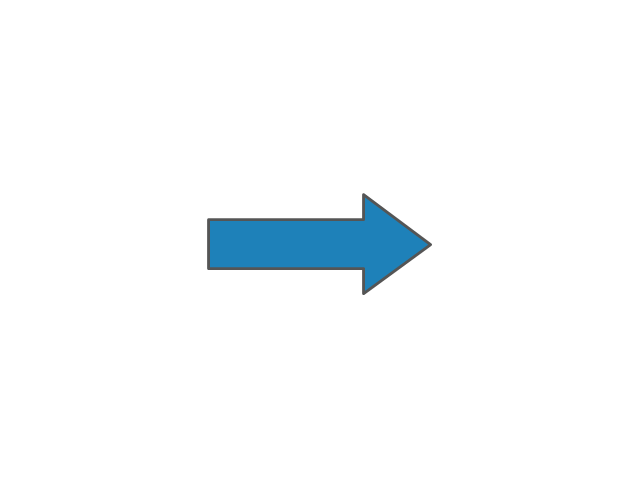
Information Flow
Shipment
Shipment
Material Flow
Material Pull

FIFO Line
Truck shipment/Logistics
Customer/Supplier
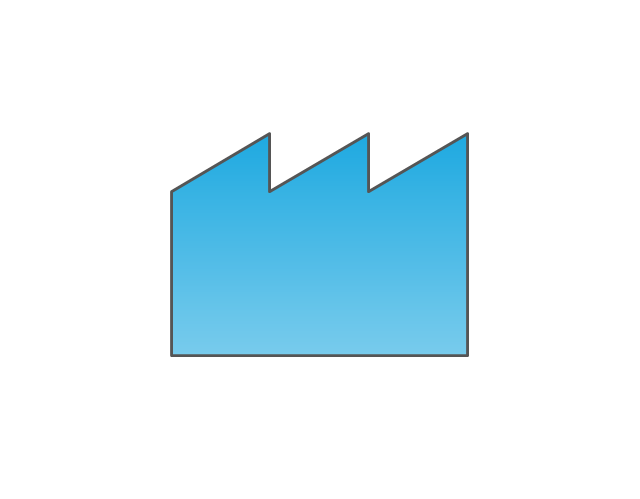
Dedicated Process

Shared Process
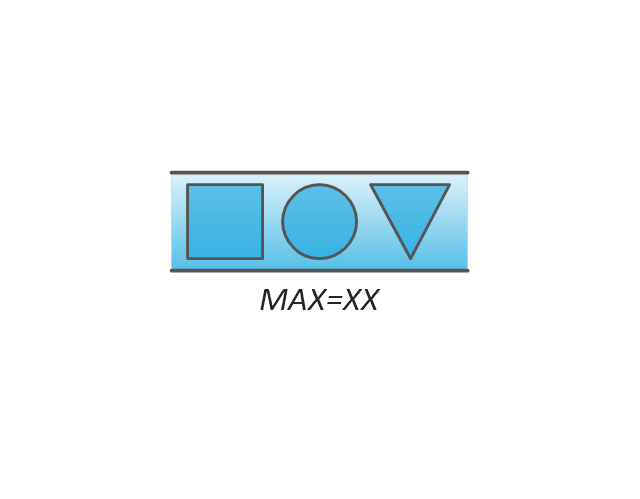
Supermarket Parts
Data Box
Workcell

Kaizen Burst

Operator

Other
Production Control
Manual Info
Electronic Information Flow
Production Kanban

Withdrawal Kanban

Signal Kanban
Kanban Post
Sequenced Pull

Load Levelling

MRP/ERP
Go-See

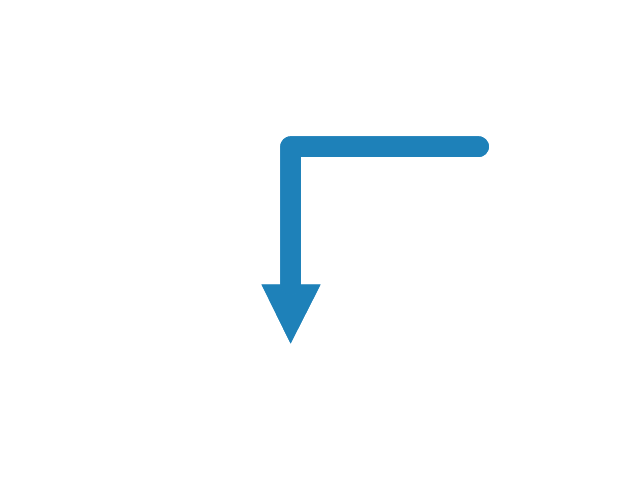
Pull Arrow
Manual Info
Pull Arrow
Timeline Total
Ship
Forklift Truck
Plane

Process with Data
Timeline
Timeline
Supermarket, 2

Supermarket, 3

Safety stock, 2

Safety stock, 3
"Value Stream Mapping (VSM):
– Special type of flow chart that uses symbols known as "the language of Lean" to depict and improve the flow of inventory information. ...
Value Stream Mapping ...
Provide optimum value to the customer through a complete value creation process with minimum waste in:
– Design (concept to customer);
– Design (concept to customer);
– Build (order to delivery);
– Sustain (in-use through life cycle to service)." [courses.washington.edu/ ie337/ Value_ Stream_ Mapping.pdf]
This sample Value Stream Map shows how customer value is created in the steps of manufacturing, production control, and shipping processes.
This VSM example was created using the ConceptDraw PRO diagramming and vector drawing software extended with the Value Stream Mapping solution from the Quality area of ConceptDraw Solution Park.
Value stream mapping

 Event-driven Process Chain (EPC) Diagrams
Event-driven Process Chain (EPC) Diagram is a type of flowchart widely used for modeling in business engineering and reengineering, business process improvement, and analysis. EPC method was developed within the Architecture of Integrated Information Systems (ARIS) framework.
HelpDesk
How to Create a VSM Diagram Using ConceptDraw Value Stream Mapping Solution
 example")
 ConceptDraw Solution Park
ConceptDraw Solution Park collects graphic extensions, examples and learning materials
Mac Compatible Remote Presentation


Process Flow Diagram

ConceptDraw PRO diagramming and vector drawing software extended with powerful tools of Flowcharts Solution from the "What is a Diagram" Area of ConceptDraw Solution Park is effective for drawing: Process Flow Diagram, Flow Process Diagram, Business Process Flow Diagrams.
ConceptDraw Arrows10 Technology

- points;
- Connecting groups of objects;
- Auto-routing;
- Connectors text;
- Snap to Guides ;
- Quick.
 Chemical and Process Engineering
This chemical engineering solution extends ConceptDraw PRO v.9.5 (or later) with process flow diagram symbols, samples, process diagrams templates and libraries of design elements for creating process and instrumentation diagrams, block flow diagrams (BFD
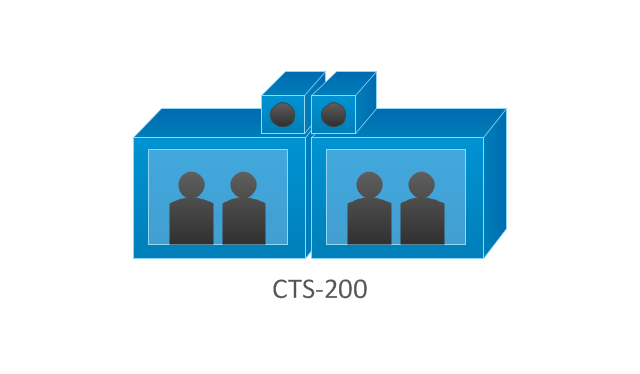
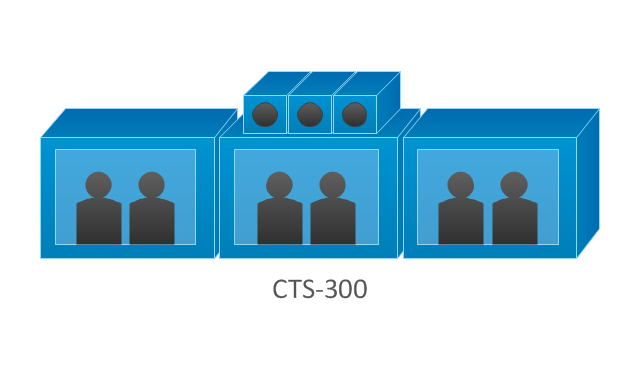
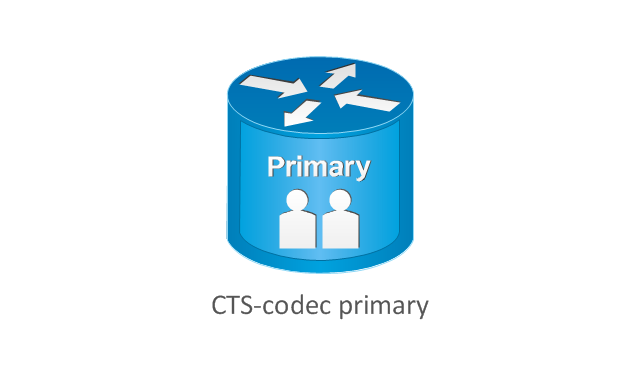
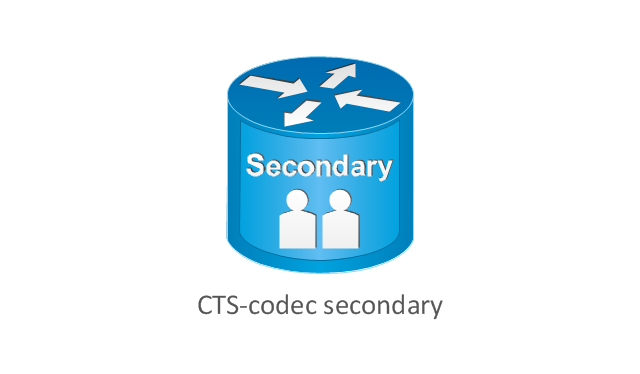
The vector stencils library "Cisco telepresence" contains 8 symbols of videoconference and telepresence equipment for drawing Cisco computer network diagrams.
"Videoconferencing is the conduct of a videoconference (also known as a video conference or videoteleconference) by a set of telecommunication technologies which allow two or more locations to communicate by simultaneous two-way video and audio transmissions. It has also been called 'visual collaboration' and is a type of groupware. ...
The core technology used in a videoconferencing system is digital compression of audio and video streams in real time. The hardware or software that performs compression is called a codec (coder/ decoder). Compression rates of up to 1:500 can be achieved. The resulting digital stream of 1s and 0s is subdivided into labeled packets, which are then transmitted through a digital network of some kind (usually ISDN or IP). The use of audio modems in the transmission line allow for the use of POTS, or the Plain Old Telephone System, in some low-speed applications, such as videotelephony, because they convert the digital pulses to/ from analog waves in the audio spectrum range.
The other components required for a videoconferencing system include:
(1) Video input : video camera or webcam.
(2) Video output: computer monitor, television or projector.
(3) Audio input: microphones, CD/ DVD player, cassette player, or any other source of PreAmp audio outlet.
(4) Audio output: usually loudspeakers associated with the display device or telephone.
(5) Data transfer: analog or digital telephone network, LAN or Internet.
(6) Computer: a data processing unit that ties together the other components, does the compressing and decompressing, and initiates and maintains the data linkage via the network." [Videoconferencing. Wikipedia]
The symbols example "Cisco telepresence - Vector stencils library" was created using the ConceptDraw PRO diagramming and vector drawing software extended with the Cisco Network Diagrams solution from the Computer and Networks area of ConceptDraw Solution Park.
www.conceptdraw.com/ solution-park/ computer-networks-cisco
CTS-100
CTS-200
CTS-300
CTS-codec primary
CTS-codec secondary
TP MCU
Cisco telepresence manager
MCU
- Value Stream Mapping Symbols | Design elements - Value stream ...
- Process Flowchart | Value Stream Mapping Symbols | Mechanical ...
- Map symbols - Vector stencils library
- Symbol Value Stream Mapping Visio
- Basic Flowchart Symbols and Meaning | Process Flowchart | Value ...
- Process Flowchart | Value Stream Mapping Symbols | Basic ...
- Process Flowchart | Value Stream Mapping Symbols | Basic ...
- Basic Flowchart Symbols and Meaning | Process Flowchart | Value ...
- Mechanical Drawing Symbols | Mechanical Engineering | Best ...
- How To use House Electrical Plan Software | Value Stream Mapping ...
- Mechanical Drawing Symbols | Process Flowchart | Best Value ...
- Value Stream Mapping
- Process Flowchart | Value Stream Mapping Symbols | Workflow ...
- | Basic Diagramming | Value Stream Mapping Symbols | Shipping ...
- Basic Flowchart Symbols and Meaning | VSM | ConceptDraw ...
- Quality Symbol Images Mechanical Engineer
- Data Flow Diagram
- Value Stream Mapping Symbols
- Symbols Of Materials Used In Technical Drawing
- Basic Flowchart Symbols and Meaning | Process Flowchart | Design ...