HelpDesk
How to Set Line Jumps for Smart Connectors in ConceptDraw PRO

 Crow's Foot Notation
Crow’s Foot Notation solution extends ConceptDraw PRO software with powerful drawing tools, samples and library of predesigned vector Crow's Foot notation icons to help you easy describe the databases using the Entity-Relationship models and design professional-looking ER diagrams based on the popular Crow's Foot notation.
Basic Flowchart Symbols and Meaning


How To Create Restaurant Floor Plan in Minutes


HelpDesk
How to Create a Timeline Diagram in ConceptDraw PRO

The vector stencils library "Transport map" contains 96 pictograms for drawing transport maps.
Use it in your spatial infographics for visual representation of transport schemes and plans as metro maps in the ConceptDraw PRO diagramming and vector drawing software extended with the Spatial Infographics solution from the area "What is Infographics" of ConceptDraw Solution Park.
Use it in your spatial infographics for visual representation of transport schemes and plans as metro maps in the ConceptDraw PRO diagramming and vector drawing software extended with the Spatial Infographics solution from the area "What is Infographics" of ConceptDraw Solution Park.
Train Railway

Bus Stop

Tramlink

Marina/Ferry Dock

Information Center

Information Center

Airport

Airport

Underground/Subway/Metro

Underground/Subway/Metro

National Rail Train Station

Taxi

Taxi

Parking

Parking

Parking

Parking

Bicycle Parking

Bicycle Parking

Fuel/Gas/Petrol

Fuel/Gas/Petrol

Police

Police
Hospital

Hospital

Wheelchair Access

Wheelchair Access

First Aid

First Aid

Telephone

Telephone

Post Office

Post Office

Landmarks and Museums

Landmarks and Museums

University

University

Shopping/Supermarket

Shopping/Supermarket

Cafe

Cafe

Food and Drinks

Food and Drinks

Man

Woman

Restrooms/Toilets

Restrooms/Toilets

Park

Park

Zoo

Zoo

Hotel

Hotel

Camping

Camping

City

Skyscraper

Building

Ocean

Straight River

Flexible River

Bridge

North Arrow
Viewpoint

Scale
Road line

Road rounded line

Road corner

Road curve 1

Road curve 2
Crossroads

Roundabout
Cloverleaf interchange

Roadway break

Railway line

Railway curve
Railway fork

Standard line with standard station - basic road

Thick line with standard station - basic road

Standard line with rectangular station - basic road

Thick line with rectangular station - basic road

Standard line with standard station - double road
Thick line with standard station - double road

Standard line with rectangular station - double road

Thick line with rectangular station - double road

Standard line with standard station - dotted road

Thick line with standard station - dotted road

Standard line with rectangular station - dotted road
Thick line with rectangular station - dotted road

Interchange Station Vertical

Interchange Station Horizontal

Transfer Station 1

Transfer Station 2
Transfer Station 3

Line Notation

Street direction
Types of Flowchart - Overview


Workflow Diagram Template

How to Create Flowcharts for an Accounting Information System

The vector stencils library "HR arrows" contains 57 arrow pictograms.
Use this arrow icon set to draw your HR flowcharts, workflow diagrams and process charts with the ConceptDraw PRO diagramming and vector drawing software.
The arrow icons library "HR arrows" is included in the HR Flowcharts solution from the Management area of ConceptDraw Solution Park.
Use this arrow icon set to draw your HR flowcharts, workflow diagrams and process charts with the ConceptDraw PRO diagramming and vector drawing software.
The arrow icons library "HR arrows" is included in the HR Flowcharts solution from the Management area of ConceptDraw Solution Park.
Arki arrow
Chevron arrow
Triangle arrow
Small arrow
Up arrow
Down arrow
Right arrow
Left arrow
Vertical moving arrow
Wavy arrow
Fat arrow
Straight arrow
Angle arrow
Double headed arrow
Single headed arrow
Elbow arrow
Crossed arrows
Turn left arrow
Turn right arrow
L-shaped arrow
Corner arrow
Diagonal arrow
Split arrow
Arc arrow
Bent arrow
Go back arrow
Double headed semicircle arrow
Counterclockwise arrow
Sector arrow
Clockwise arrow
Arrow fork
Merging arrows

U-shaped arrow
Semicircle arrow
Circular arrow
Looping arrows
Refresh arrows
Double arc arrow
Curving directional arrow
S-shaped arrow
Short arc arrow
Long arc arrow
Turn round arrow
Rotating arrows
Turned arrow
Curved left arrow
Curved right arrow
Cycle arrow
Arrow loop
Moving down arrow
Moving up arrow
Dual short arc arrow
Recycling arrows

Interaction arrows

Lightning arrow
Ribbon arrow
Circular motion arrows
The vector stencils library "Transport map" contains 96 pictograms for drawing transport maps.
Use it in your spatial infographics for visual representation of transport schemes and plans as metro maps in the ConceptDraw PRO diagramming and vector drawing software extended with the Spatial Infographics solution from the area "What is Infographics" of ConceptDraw Solution Park.
Use it in your spatial infographics for visual representation of transport schemes and plans as metro maps in the ConceptDraw PRO diagramming and vector drawing software extended with the Spatial Infographics solution from the area "What is Infographics" of ConceptDraw Solution Park.
Train Railway
Bus Stop
Tramlink
Marina/Ferry Dock
Information Center
Information Center
Airport
Airport
Underground/Subway/Metro
Underground/Subway/Metro
National Rail Train Station
Taxi
Taxi
Parking
Parking
Parking
Parking
Bicycle Parking
Bicycle Parking
Fuel/Gas/Petrol
Fuel/Gas/Petrol
Police
Police
Hospital
Hospital
Wheelchair Access
Wheelchair Access
First Aid
First Aid
Telephone
Telephone
Post Office
Post Office
Landmarks and Museums
Landmarks and Museums
University
University
Shopping/Supermarket
Shopping/Supermarket
Cafe
Cafe
Food and Drinks
Food and Drinks
Man
Woman
Restrooms/Toilets
Restrooms/Toilets
Park
Park
Zoo
Zoo
Hotel
Hotel
Camping
Camping
City
Skyscraper
Building
Ocean
Straight River
Flexible River
Bridge
North Arrow
Viewpoint
Scale
Road line
Road rounded line
Road corner
Road curve 1
Road curve 2
Crossroads
Roundabout
Cloverleaf interchange
Roadway break
Railway line
Railway curve
Railway fork
Standard line with standard station - basic road
Thick line with standard station - basic road
Standard line with rectangular station - basic road
Thick line with rectangular station - basic road
Standard line with standard station - double road
Thick line with standard station - double road
Standard line with rectangular station - double road
Thick line with rectangular station - double road
Standard line with standard station - dotted road
Thick line with standard station - dotted road
Standard line with rectangular station - dotted road
Thick line with rectangular station - dotted road
Interchange Station Vertical
Interchange Station Horizontal
Transfer Station 1
Transfer Station 2
Transfer Station 3
Line Notation
Street direction
Competitor Analysis

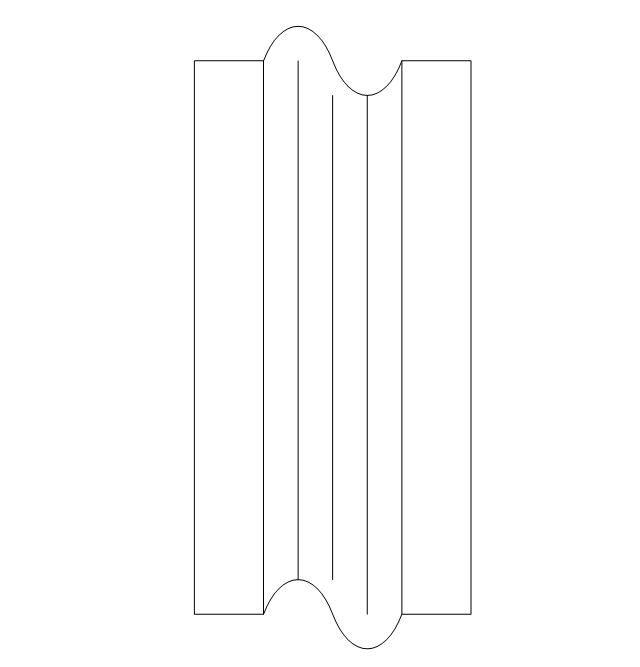
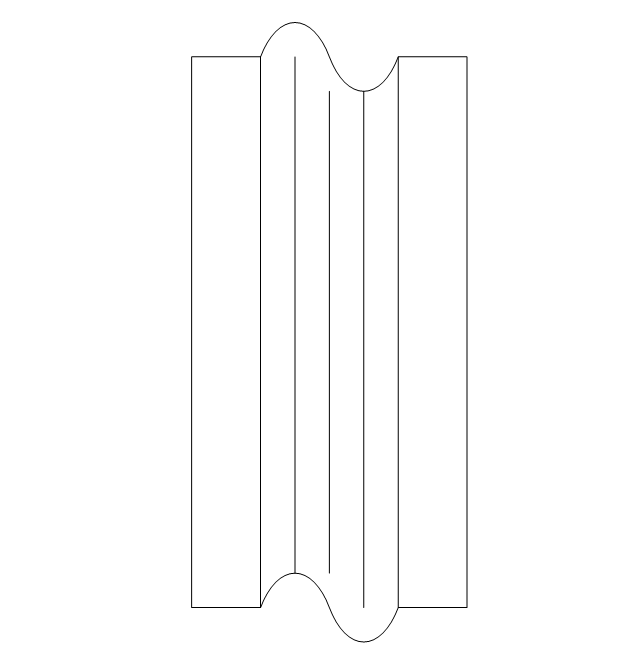
The vector stencils library "HVAC ductwork" contains 55 duct and vent symbols of HVAC mechanical components. Use it for drawing HVAC ductwork system diagrams, heating, ventilation, air conditioning, refrigeration, automated building control, and environmental control design in the ConceptDraw PRO diagramming and vector drawing software extended with the HVAC Plans solution from the Building Plans area of ConceptDraw Solution Park.
Rect. duct, closed ends
Rect. duct, open 1 end
Rect. duct, open both ends
Circ. duct, closed ends
Circ. duct, open 1 end
Circ. duct, open both ends
Branch duct, rectangular
Branch duct, circular
Variable bend
Miter bend
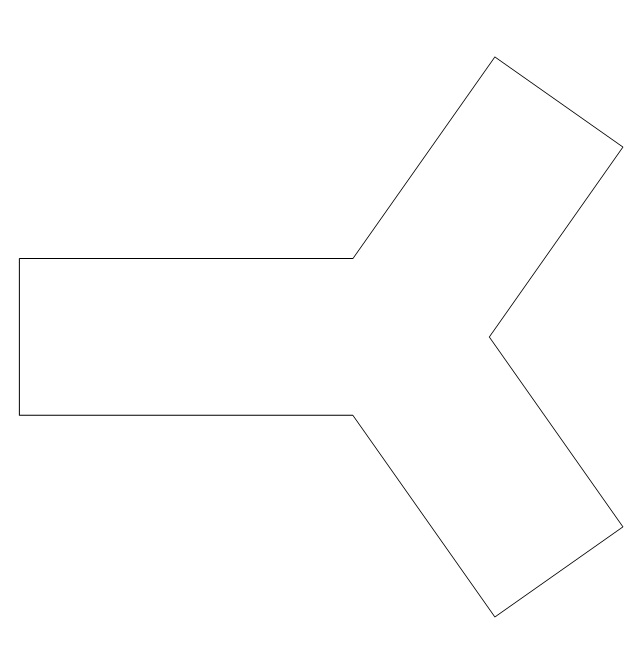
Y junction
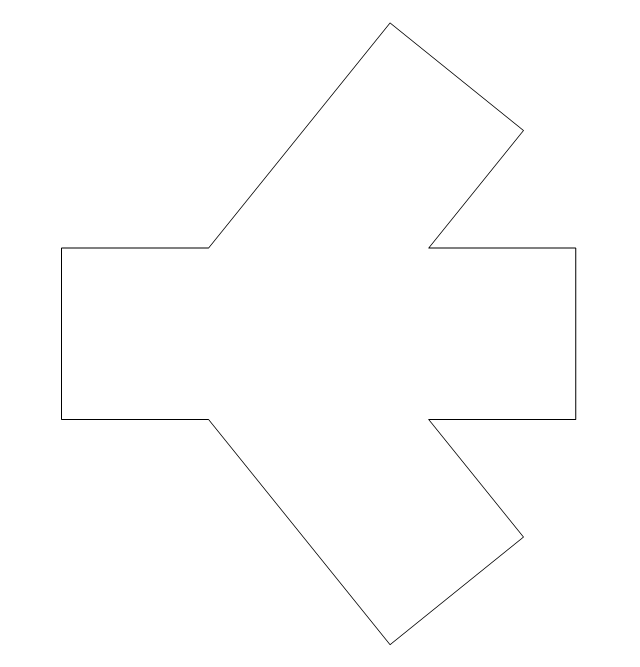
3 way junction
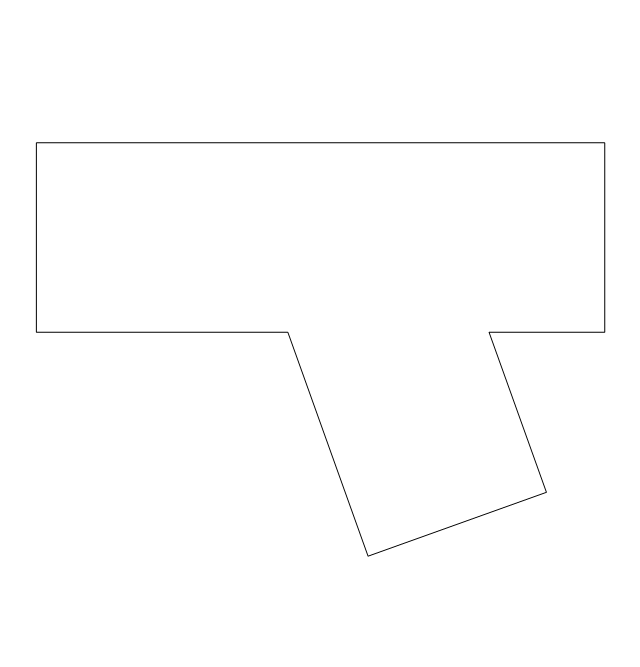
Junction 1
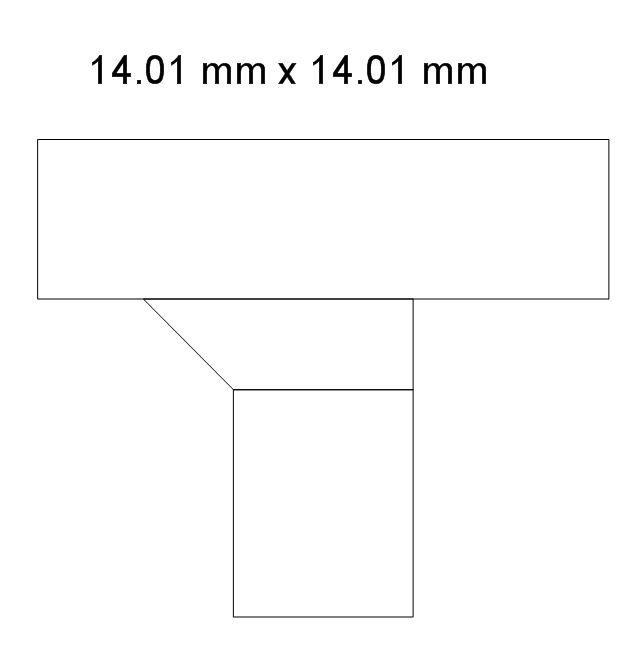
Beveled junction, rect. duct, rect. branch
Beveled junction, rect. duct, circ. branch
Beveled junction, circ. duct, rect. branch
Beveled junction, circ. duct, circ. branch
Transition, rect. to rect.
Transition, rect. to circ.
Transition, circ. to rect.
Transition, circ. to circ.
Offset transition, rect. to rect.
Offset transition, rect. to circ.
Offset transition, circ. to rect.
Offset transition, circ. to circ.
Flexible connection, rect. duct
Flexible connection, circ. duct
Flexible connection 2, rect. duct
Flexible connection 2, circ. duct
Supply, rect. duct toward

Supply, rect. duct away

Supply, rect. duct, elbow away
Supply, circ. duct toward
Supply, circ. duct away

Supply, circ. duct, elbow away
Return, rect. duct toward
Return, rect. duct away
Return, rect. duct, elbow away
Return, circ. duct toward

Return, circ. duct away

Return, circ. duct, elbow away
Sliding damper, rect. duct
Sliding damper, circ. duct
Damper, ACD
Damper, BD
Damper, FD/AD
Damper, MD

Damper, SD/AD
Vert. duct, rect. duct toward
Vert. duct, rect. duct away
Vert. duct, rect. duct, elbow away
Vert. duct, circ. duct toward

Vert. duct, circ. duct away

Vert. duct, circ. duct, elbow away
VAV box
The vector stencils library "Sales arrows" contains 57 arrow symbols.
Use these arrow icon set to draw your sales flowcharts, workflow diagrams and process charts with the ConceptDraw PRO diagramming and vector drawing software.
The arrow pictograms library "Sales arrows" is included in the Sales Flowcharts solution from the Marketing area of ConceptDraw Solution Park.
Angle arrow
Arc arrow
Arki arrow
Arrow fork
Arrow loop
Bent arrow
Chevron arrow
Circular arrow
Circular motion arrows

Clockwise arrow
Corner arrow
Counterclockwise arrow
Crossed arrows

Curved left arrow
Curved right arrow
Curving directional arrow
Cycle arrow
Diagonal arrow
Double arc arrow
Double headed arrow
Double headed semicircle arrow
Down arrow
Dual short arc arrow
Elbow arrow
Fat arrow
Go back arrow
Interaction arrows

L-shaped arrow
Left arrow
Lightning arrow
Long arc arrow
Looping arrows

Merging arrows

Moving down arrow
Moving up arrow
Recycling arrows

Refresh arrows

Ribbon arrow
Right arrow
Rotating arrows
S-shaped arrow
Sector arrow
Semicircle arrow
Short arc arrow
Single headed arrow
Small arrow
Split arrow
Straight arrow
Triangle arrow
Turn left arrow
Turn right arrow
Turn round arrow
Turned arrow
Up arrow
U-shaped arrow
Vertical moving arrow
Wavy arrow
 Scatter Diagrams
The Scatter Diagrams solution extends ConceptDraw PRO v10 functionality with templates, samples, and a library of vector stencils that make construction of a Scatter Plot easy. The Scatter Chart Solution makes it easy to design attractive Scatter Diagrams used in various fields of science, work, and life activities. ConceptDraw PRO lets you enter the data to the table and construct the Scatter Plot Graph automatically according to these data.
- Vertical Straight Line Png
- Vertical Line Chart
- White Vertical Line Png
- Cross-Functional Flowchart | Vertical Web Separator Png
- Line Vertical Image Png
- Verticle Straight Line Design
- Straight Line Divider Png
- How to Create a Line Chart | Horizontal colored football field ...
- Straight Black Line Png
- Vertical Line Icon
- Vertical Line For Website
- Curved Lines Design Png
- Word Exchange | Loading Bar Gif Transparent Background
- Vertical Separator Lines Png
- Device creep and creepy devices - Marketing infographics | Line ...
- Scrolling Bar Vertical Png
- How I Represent Dashed Line Notation In Straight Line
- Line Graph Icon Png
- Football Field Vertical Icon
- Line Chart Vector Png