This IDEF3 diagram example was redesigned from the Wikimedia Commons file: 2-02 Example of a Transition Schematic.jpg.
[commons.wikimedia.org/ wiki/ File:2-02_ Example_ of_ a_ Transition_ Schematic.jpg]
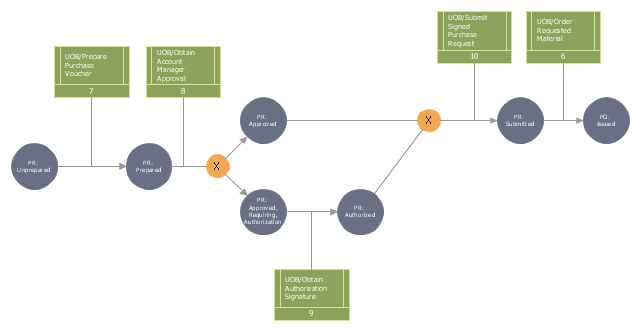
"The schematic in Figure 2-2 represents an Object Schematic for the Order Material scenario derived from the business owner’s description. This example happens to illustrate a Transition Schematic since it characterizes the nature and structure of object state transitions for occurrences of the Order Material scenario. A key document in this process is the Purchase Request form. This form is eventually transformed into a Purchase Order (PO) via the Order Material process. A circle containing the name of an object represents an object of a certain kind (e.g., Purchase Request, Account Manager, Project). These labeled circles are known as kind symbols. A certain kind of object being in a certain state is represented by a circle with a label that captures both the kind itself and a corresponding state, thereby representing the type (or class) of objects that are in that state (within a given process). ... One of the first steps to develop an Object Schematic is to identify the possible states in which the object can exist. Though a real-world object often evolves through a continuum of states, an Object Schematic focuses on those distinguished states of particular interest to the domain expert. The transition arcs (arrows with triangular, filled-in heads) connecting the circles symbolize a state transition, the activity of changing from one state to another. The conditions that establish when an object is in a given state, how it exists a state, how it can transition between states, and how it can enter a new state are recorded on a special form. The banded boxes linked to the arrows (called referents) are aids to describe the relationships between objects states and UOBs, scenarios, or other Transition Schematics that participate in a scenario occurrence. ... The transition junctions containing an “X” (for exclusive or) indicate the choice of exactly one path among several possible paths in an occurrence." [IDEF3 Process Description Capture Method Report AL-TR-1995-XXXX. idef.com/ pdf/ Idef3_ fn.pdf]
The diagram "Transition schematic - IDEF3 diagram example" was created using the ConceptDraw PRO diagramming and vector drawing software extended with the solution "IDEF Business Process Diagrams" from the area "Business Processes" of ConceptDraw Solution Park.
[commons.wikimedia.org/ wiki/ File:2-02_ Example_ of_ a_ Transition_ Schematic.jpg]
"The schematic in Figure 2-2 represents an Object Schematic for the Order Material scenario derived from the business owner’s description. This example happens to illustrate a Transition Schematic since it characterizes the nature and structure of object state transitions for occurrences of the Order Material scenario. A key document in this process is the Purchase Request form. This form is eventually transformed into a Purchase Order (PO) via the Order Material process. A circle containing the name of an object represents an object of a certain kind (e.g., Purchase Request, Account Manager, Project). These labeled circles are known as kind symbols. A certain kind of object being in a certain state is represented by a circle with a label that captures both the kind itself and a corresponding state, thereby representing the type (or class) of objects that are in that state (within a given process). ... One of the first steps to develop an Object Schematic is to identify the possible states in which the object can exist. Though a real-world object often evolves through a continuum of states, an Object Schematic focuses on those distinguished states of particular interest to the domain expert. The transition arcs (arrows with triangular, filled-in heads) connecting the circles symbolize a state transition, the activity of changing from one state to another. The conditions that establish when an object is in a given state, how it exists a state, how it can transition between states, and how it can enter a new state are recorded on a special form. The banded boxes linked to the arrows (called referents) are aids to describe the relationships between objects states and UOBs, scenarios, or other Transition Schematics that participate in a scenario occurrence. ... The transition junctions containing an “X” (for exclusive or) indicate the choice of exactly one path among several possible paths in an occurrence." [IDEF3 Process Description Capture Method Report AL-TR-1995-XXXX. idef.com/ pdf/ Idef3_ fn.pdf]
The diagram "Transition schematic - IDEF3 diagram example" was created using the ConceptDraw PRO diagramming and vector drawing software extended with the solution "IDEF Business Process Diagrams" from the area "Business Processes" of ConceptDraw Solution Park.
IDEF3 business process diagram
Material Requisition Flowchart. Flowchart Examples

Process Flowchart


Flowchart Components

State Diagram Example - Online Store

Value stream with ConceptDraw PRO

Types of Flowcharts


UML Activity Diagram. Design Elements
")

Learn how to create a current state value stream map

BPMN 2.0

- State Chart Diagrams For Online Order
- State Chart Diagram To Request For Material
- Purchase order processing UML activity diagram | ConceptDraw ...
- Transition schematic - IDEF3 diagram example | Computer and ...
- Diagramming Software for Design UML State Machine Diagrams ...
- Deployment Diagram In Uml For Materials And Chemicals
- Ordering Process Flowchart. Flowchart Examples | Material ...
- Material Requisition Flowchart. Flowchart Examples | Purchasing ...
- Transition schematic - IDEF3 diagram example | Completed ...
- Schematic Diagram Showing Process State