HelpDesk
How to Create an Enterprise Architecture Diagram
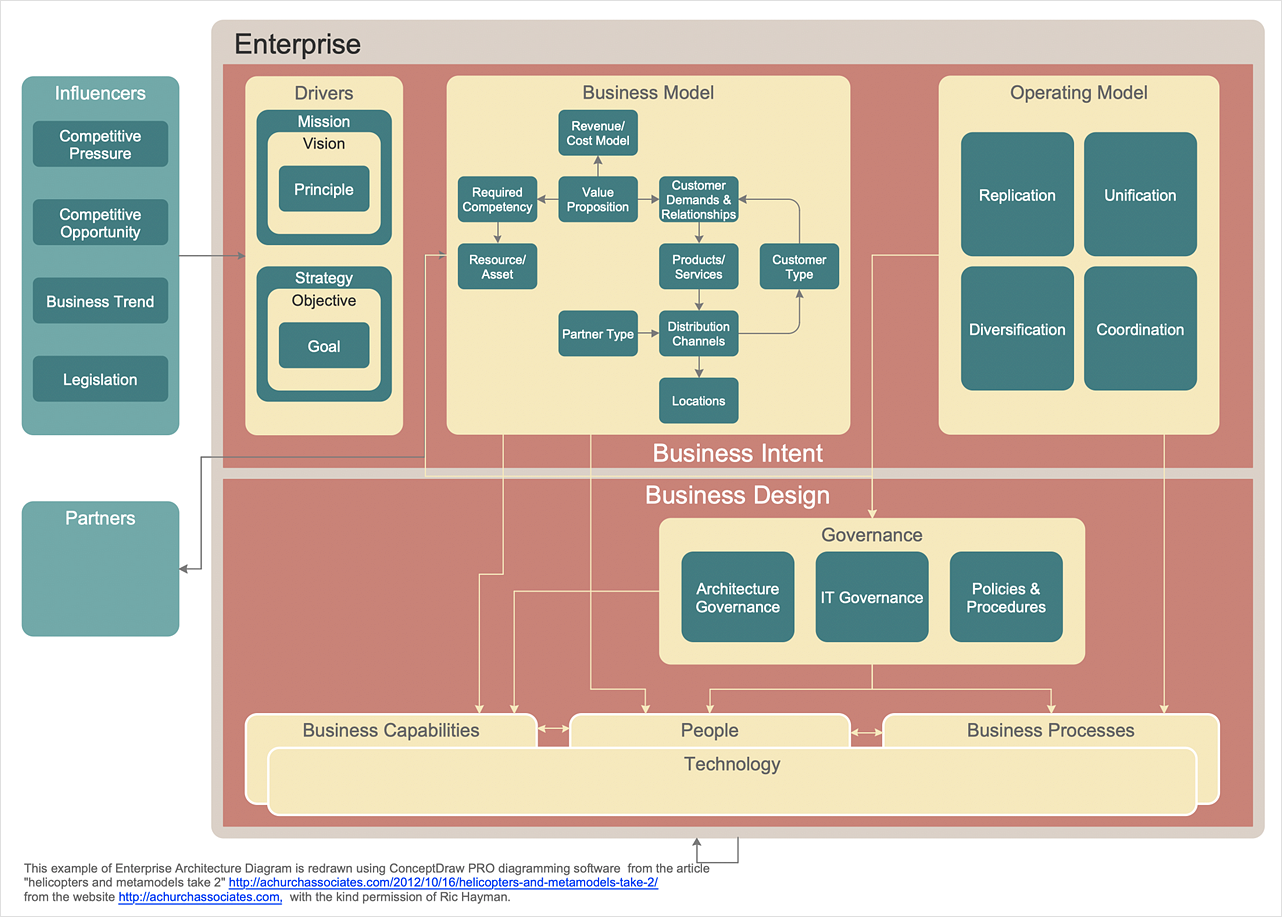
An Enterprise Architecture (EA) diagram is used to display the structure and operations of an organization. It is used to analyze and document an organization and its business functions, along with the applications and systems on which they are implemented. The aim of an enterprise architecture diagram is to determine how an organization can effectively achieve its current and future objectives. The Enterprise Architecture often uses diagrams to support the decision-making process. ConceptDraw DIAGRAM allows you to design Enterprise Architecture diagrams of any complexity.HelpDesk
How to Create an IDEF0 Diagram for an Application Development
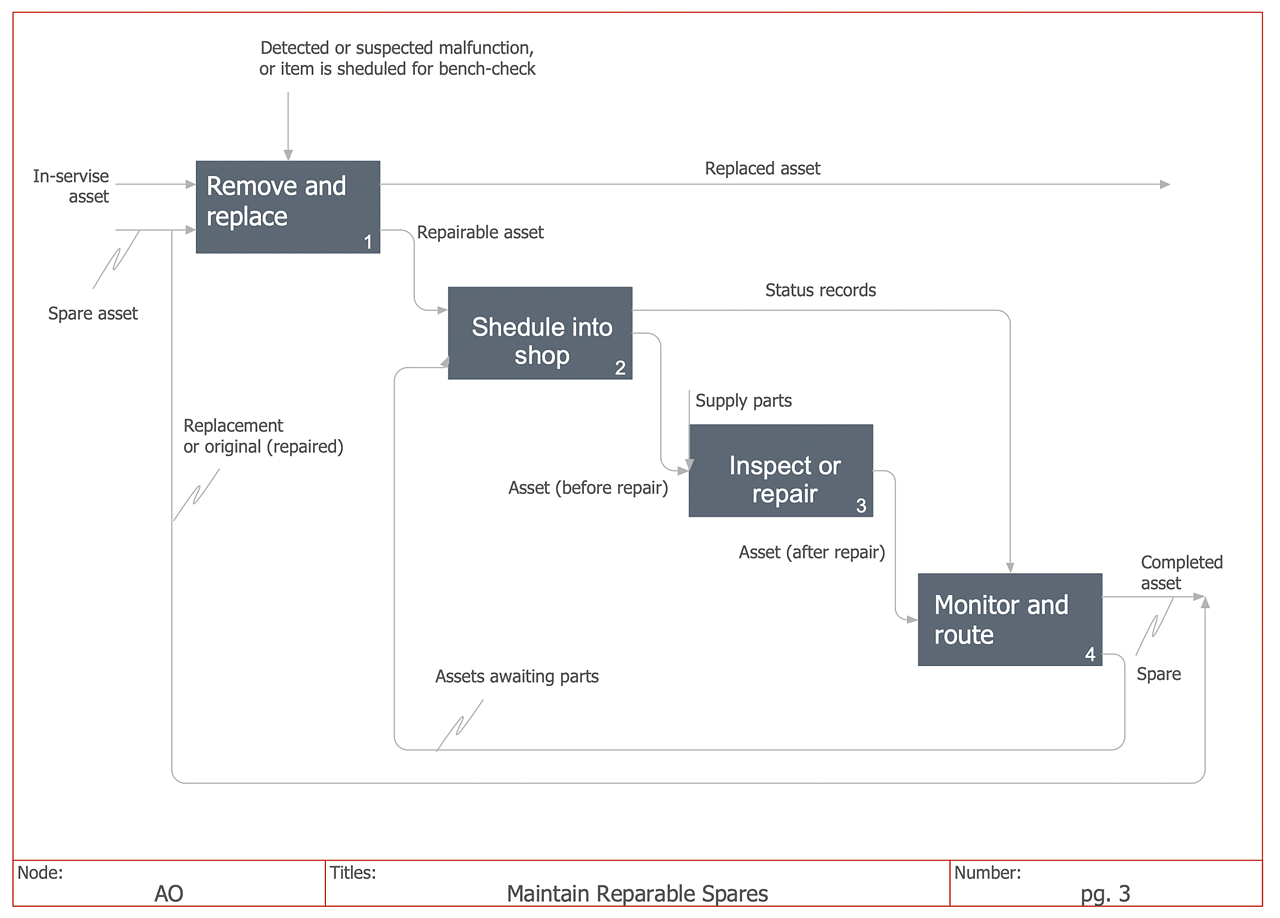
IDEF0 methods are intended to model the functions of a process, creating a graphical model that displays: what controls the function, who makes it, what resources are used and how they are connected with other functions. The IDEF0 tool is used to model the decisions, actions, and activities of a software system during the development process. IDEF0 diagram graphically depicts a model of a desired version of the application. ConceptDraw DIAGRAM allows you to create and communicate the IDEF0 diagrams of any complexity.HelpDesk
Event-driven Process Chain (EPC) Diagram Software
An EPC diagram is a type of flowchart used in business process analysis. It shows different business processes through various work flows. The workflows are shown as processes and events that are related to different executes and tasks that allow business workflow to be completed. An EPC diagram shows different business processes through various workflows. The workflows are seen as functions and events that are connected by different teams or people, as well as tasks that allow business processes to be executed. The best thing about this type of enterprise modelling is that creating an EPC diagram is quick and simple as long as you have the proper tool. One of the main usages of the EPC diagrams is in the modelling, analyzing and re-engineering of business processes. With the use of the flowchart, businesses are able to see inefficiencies in the processes and modify to make them more productive. Event-driven process chain diagrams are also used to configure an enterprise resource plaHelpDesk
How to Draw a Block Diagram
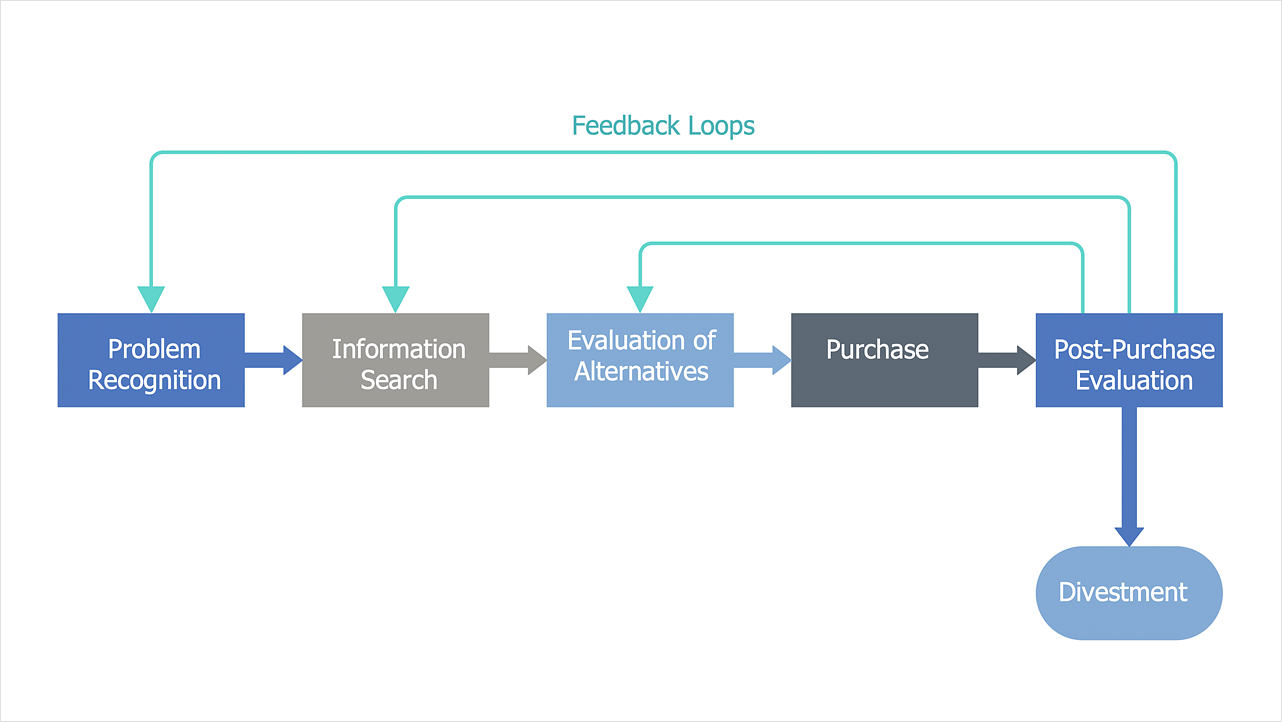
Block diagram is a simple chart that use blocks to show some elements or activities, and connectors that show the relationship between neighboring blocks. They are commonly simple, giving an overview of a process without necessarily going into the specifics of implementation. Block diagrams are commonly used to depict a general description of a system and its activity. A most known sample of a block diagram is a flow chart, used in many types of business as a common method of representing repeated processes. Easy and a simple creation, a number of objects and connectors make the block diagram a many-sided tool for various industries. The ability to make block diagrams is delivered by the ConceptDraw Block Diagrams solution.
 Business Processes Area
Solutions of Business Processes area extend ConceptDraw DIAGRAM software with samples, templates and vector stencils libraries for drawing business process diagrams and flowcharts for business process management.
HelpDesk
How to Create a Data Flow Diagram
Data flow diagramming is a highly effective technique for showing the flow of information through a system. Data flow diagrams reveal relationships among and between the various components in a program or system. DFD is an important technique for modeling a system’s high-level detail by showing how input data is transformed to output results through a sequence of functional transformations. The set of standard symbols is used to depict how these components interact in a system. ConceptDraw DIAGRAM allows you to draw a simple and clear Data Flow Diagram using special libraries.Software development with ConceptDraw DIAGRAM
Modern software development requires creation of large amount of graphic documentation, these are the diagrams describing the work of applications in various notations and cuts, also GUI design and documentation on project management. ConceptDraw DIAGRAM technical and business graphics application possesses powerful tools for software development and designing technical documentation for object-oriented projects. Solutions included to the Software Development area of ConceptDraw Solution Park provide the specialists with possibility easily and quickly create graphic documentation. They deliver effective help in drawing thanks to the included package of templates, samples, examples, and libraries with numerous ready-to-use vector objects that allow easily design class hierarchies, object hierarchies, visual object-oriented designs, flowcharts, GUI designs, database designs, visualize the data with use of the most popular notations, including the UML and Booch notations, easy manage the development projects, automate projection and development.
 Software Development Area
Solutions from the Software Development Area of ConceptDraw Solution Park collect templates, samples and libraries of vector stencils for drawing the software engineering diagrams and user interface design prototypes.
- Swim Lane Diagrams | Cross-Functional Flowchart (Swim Lanes ...
- Basic Flowchart Symbols and Meaning | Flowchart design ...
- Business Process Diagram | Cross-Functional Flowcharts | Event ...
- Cross-Functional Flowcharts | Business Process Modeling Notation ...
- Data Flow Diagram Symbols. DFD Library | Basic Flowchart ...
- Basic Flowchart Symbols and Meaning | Design elements - IDEF0 ...
- Basic Flowchart Symbols and Meaning | Cross Functional Flowchart ...
- IDEF0 Diagrams | IDEF0 Diagram | IDEF0 diagram template | Idef0
- IDEF0 diagram template | Process Flowchart | SysML block ...
- Process Flowchart | Software development with ConceptDraw PRO ...
- Basic Flowchart Symbols and Meaning | How to Draw a Flowchart ...
- Workflow Process Example | Event-driven Process Chain Diagrams ...
- Cross-Functional Flowcharts | Business Processes | Cross ...
- IDEF0 diagram template | Business Processes | Cross-Functional ...
- Business Process Modeling Notation Template | Business Process ...
- Basic Flowchart Symbols and Meaning | Design elements - IDEF0 ...
- Design elements - IDEF0 diagram | Diagramming software for ...
- 5 level pyramid model diagram of information systems types ...
- Dfd Symbol Using Standard Graphics Library Function Program


