Spider Chart Template
This sample shows the Spider Chart that represents the budget and spending for one organization and allows to compare them. The multivariate data are represented on the Spider Chart as a two-dimensional chart with four or more variables displayed on the axes that start in one point. The Spider Charts are used in the management, business and sport.Chart Maker for Presentations
Easy charting software comes with beautiful chart templates and examples. This makes it easy to create professional charts without prior experience.Radar Chart
This sample shows the Radar Chart that compares the internet dimensions in the four countries. The Radar Chart represents the multivariate data as a two-dimensional chart with three or more variables displayed on the axes that start in one point. The Radar Charts are used in the quality management, business, analytics and sport.Flowchart Software
Flowchart is widely used in business, education and economic presentations to help the audience visualize the content better, or to find flaws in a process flow diagrams. Flowcharts are particularly useful for displaying how a process currently flow or could ideally function. Flowcharts can help you see whether the steps of a process are logical, uncover problems or miscommunications, define the boundaries of a process, and develop a common base of knowledge about a process.ConceptDraw DIAGRAM flowchart software will help to quickly create new flowcharts, workflow, NS Diagram, BPMN Diagram, Cross-functional flowcharts, data flow diagrams and highlight flowcharts.
Feature-rich flowchart maker, free thousand flowchart examples and templates and colored symbols that will allow you to create professional looking flowcharts simply.
ConceptDraw DIAGRAM supports macOS and Windows.
How to Create a Line Chart
Create a Line Chart with ConceptDraw using our tips. Here you can find an explanation of how to create a line chart quickly.Pie Chart Word Template. Pie Chart Examples
The Pie Chart visualizes the data as the proportional parts of a whole and looks like a disk divided into sectors. The pie chart is type of graph, pie chart looks as circle devided into sectors. Pie Charts are widely used in the business, statistics, analytics, mass media. It’s very effective way of displaying relative sizes of parts, the proportion of the whole thing.Chart Software for Better Presentations
Easy charting software comes with beautiful chart templates and examples. This makes it easy to create professional charts without prior experience.Graphs and Charts Area provide a wide collection of professional looking predesigned templates, samples and ready-to-use vector stencils that will help you to draw the charts and diagrams of various types: Pie Charts, Donut Charts, Line Charts, Column Charts, Bar Charts, Pyramids, Scatter Charts, Venn Diagrams, Spider Charts, Area Charts, Divided Bar Graphs.
Column Chart Software
ConceptDraw Column Chart software allows drawing column charts using predesigned objects or drawing tools. In ConceptDraw Column Chart software you can find a complete set of column chart tools and objects.Bar Chart
ConceptDraw DIAGRAM extended with Bar Graphs solution from Graphs and Charts area of ConceptDraw Solution Park is ideal software for quick and simple drawing bar chart of any complexity graph.Scatter Chart Examples
The Line Graphs solution from Graphs and Charts area of ConceptDraw Solution Park contains a set of examples, templates and design elements library of scatter charts.Use it to draw scatter graphs using ConceptDraw DIAGRAM diagramming and vector drawing software for illustrating your documents, presentations and websites.
Audit Flowcharts
Audit flowcharts solution extends ConceptDraw DIAGRAM software with templates, samples and library of vector stencils for drawing the audit and fiscal flow charts.
Sales Growth. Bar Graphs Example
This sample was created in ConceptDraw DIAGRAM diagramming and vector drawing software using the Bar Graphs Solution from Graphs and Charts area of ConceptDraw Solution Park. It is Bar Graphs example, Sales Growth example, Column Chart Example - Sales Report.Visio Files and ConceptDraw
Visio Files and ConceptDraw. ConceptDraw DIAGRAM is compatible with MS Visio.VDX formatted files.VDX is Visio’s open XML file format, and it can be easily imported and exported by ConceptDraw DIAGRAM.
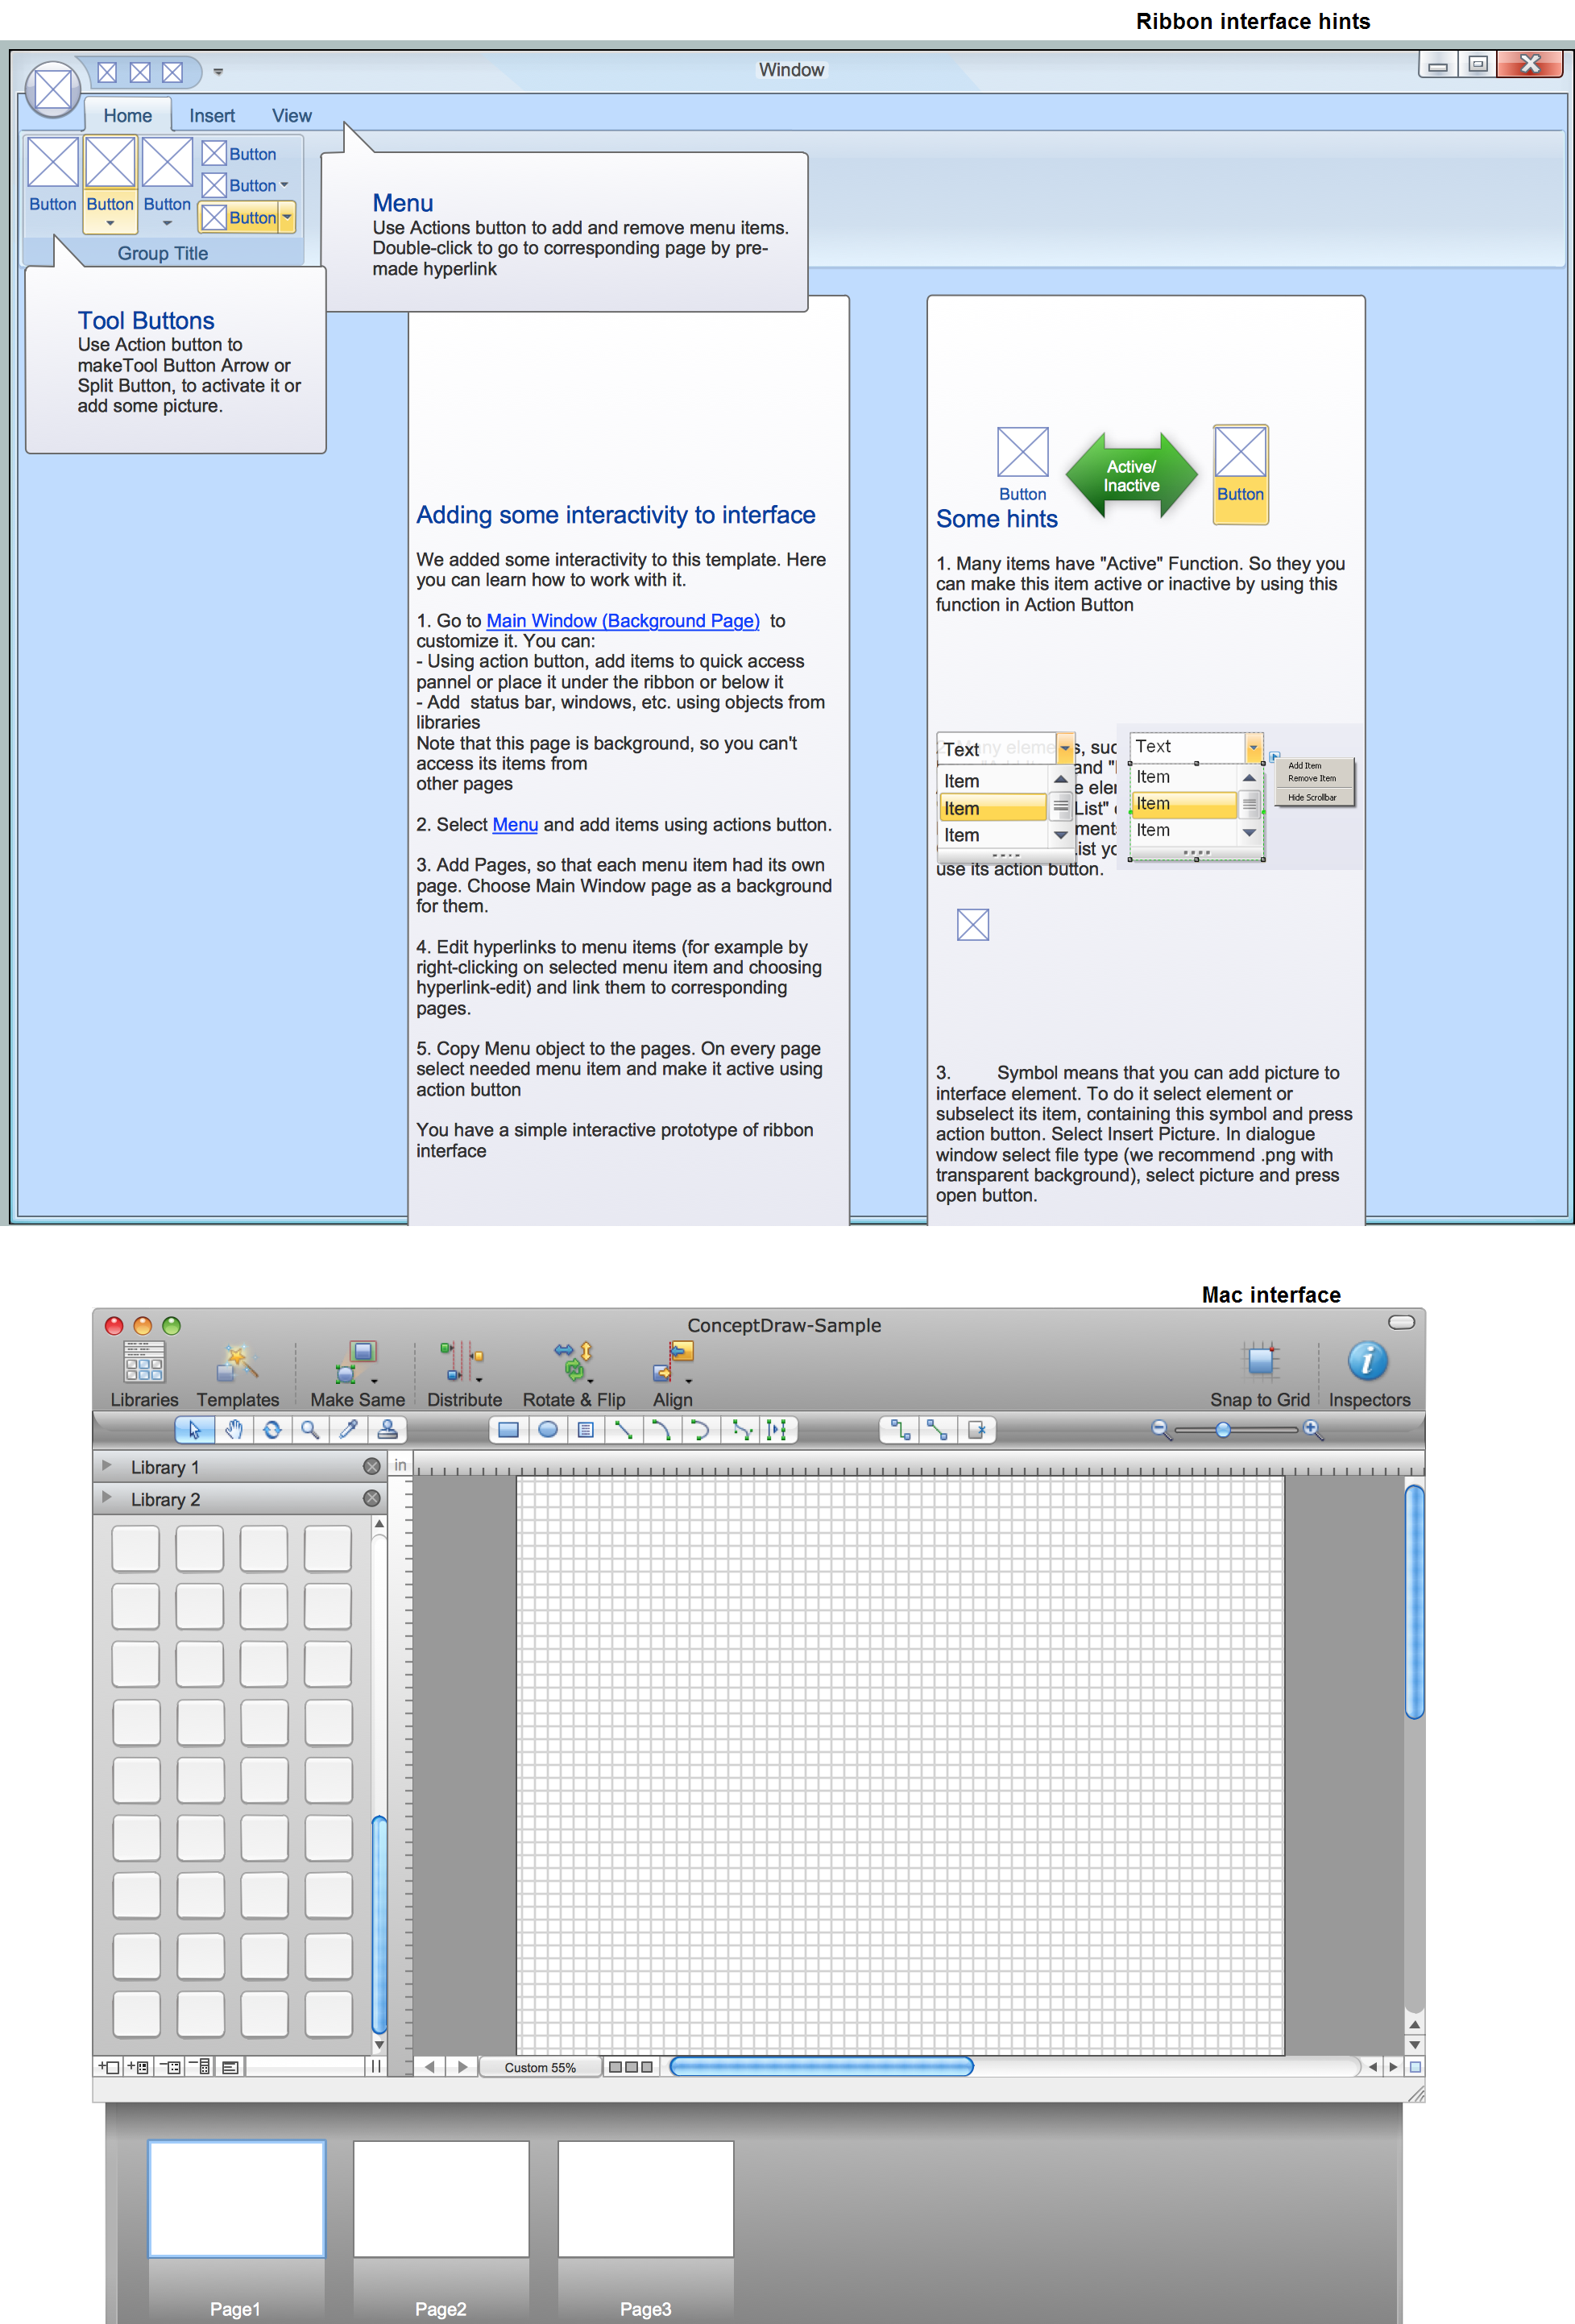
GUI Prototyping with ConceptDraw DIAGRAM
All about prototyping. GUI Prototyping with ConceptDraw. Download prototyping software.- Spider Chart Template | Percentage Spider Chart | Chart Maker for ...
- Spider Chart Template
- Flowchart Software | Spider Chart Template | Pie Chart Word ...
- Spider Chart Template | Chart Maker for Presentations | Technical ...
- Spider Chart Template | Flowchart Software | Audit Flowcharts ...
- Spider Chart Template | Flowchart Software | Percentage Spider ...
- Spider Chart Template | Donut Chart Templates | Line Chart ...
- Spider Chart Template | GUI Prototyping with ConceptDraw PRO ...
- Spider Chart Template | Flowchart Software | Blank Scatter Plot ...
- Spider Chart Template | Process Flowchart | Spider Daigram On ...
- Spider Chart Template | Radar Chart | Flowchart Software | Spider ...
- Blank Spider Diagram Template
- Spider Chart Template | Flowchart Software | Chart Maker for ...
- Flowchart Software | Spider Chart Template | Process Flowchart ...
- Spider Chart Template | Radar Chart | Flowchart Software | Process ...
- Spider Chart Template | Radar Chart | Column Chart Software ...
- Pie Chart Word Template . Pie Chart Examples | Spider Chart ...
- Cross-Functional Flowcharts | SysML Diagram | Spider Chart ...
- Radar Chart | Aircraft - Design Elements | Spider Chart Template ...
- Basic Chart Template
- ERD | Entity Relationship Diagrams, ERD Software for Mac and Win
- Flowchart | Basic Flowchart Symbols and Meaning
- Flowchart | Flowchart Design - Symbols, Shapes, Stencils and Icons
- Flowchart | Flow Chart Symbols
- Electrical | Electrical Drawing - Wiring and Circuits Schematics
- Flowchart | Common Flowchart Symbols