Fault Tree Analysis Software
ConceptDraw Arrows10 Technology

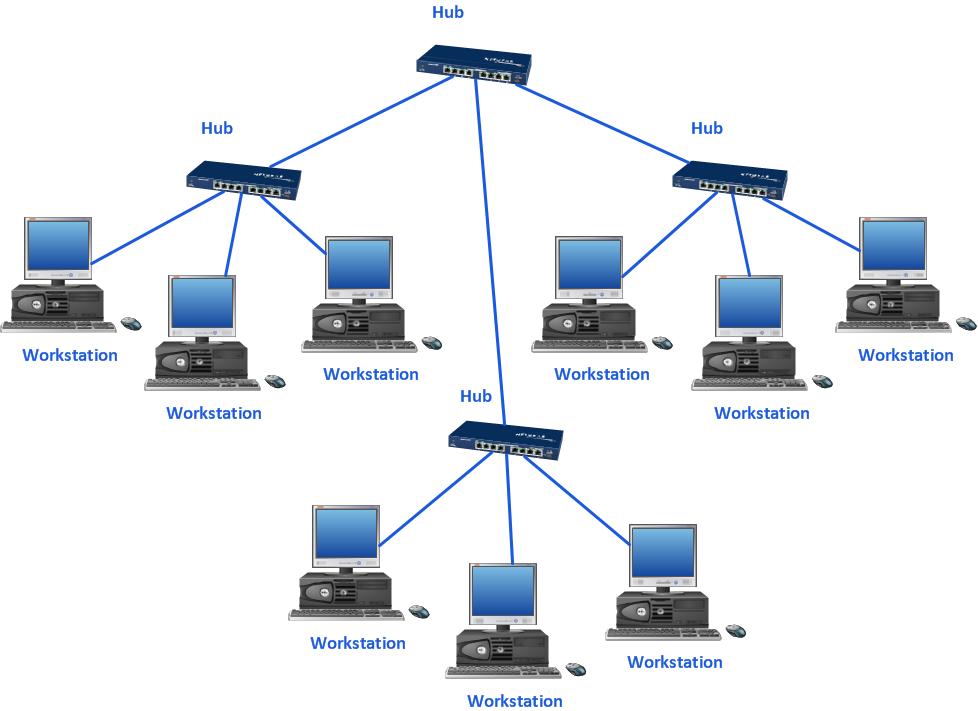
Tree Network Topology Diagram

PROBLEM ANALYSIS. Root Cause Analysis Tree Diagram


Project —Task Trees and Dependencies

Fault Tree Analysis Example
Fault Tree Diagram

Root Cause Analysis

 Fault Tree Analysis Diagrams
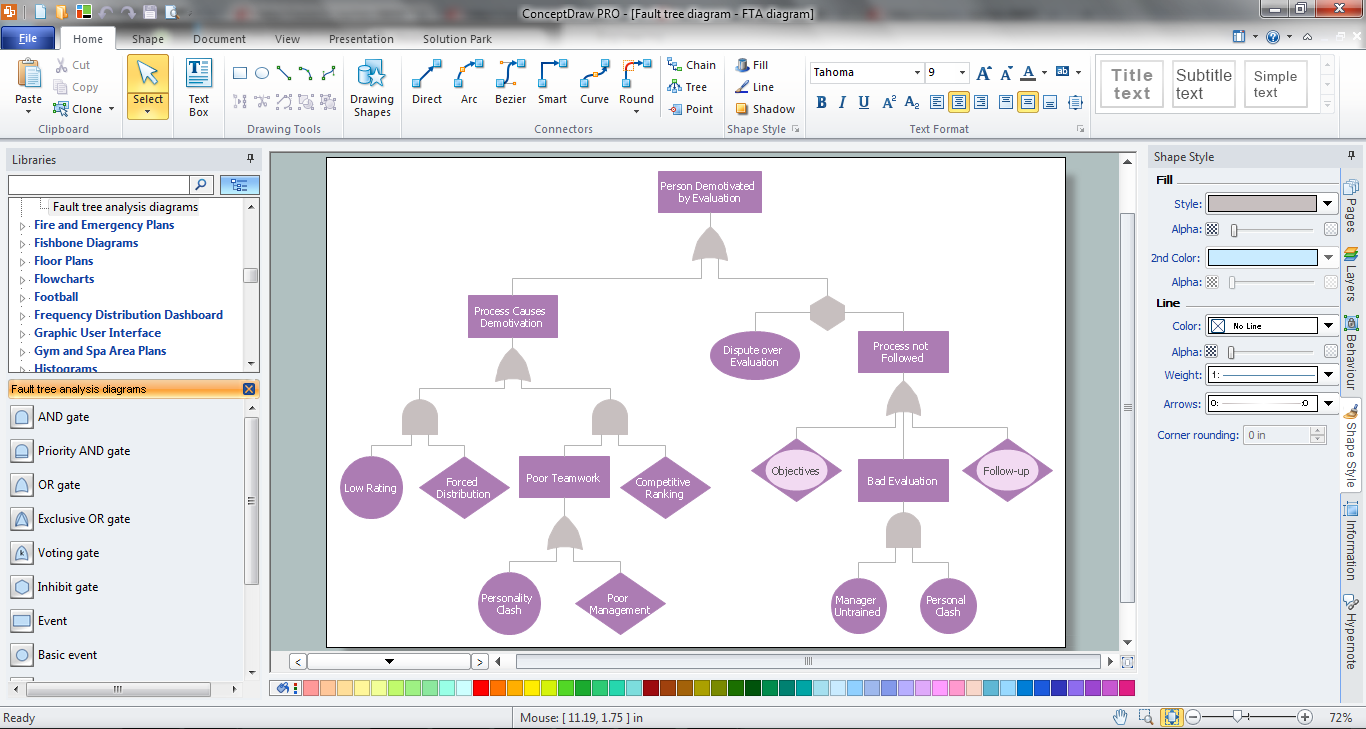
This solution extends ConceptDraw DIAGRAM.5 or later with templates, fault tree analysis example, samples and a library of vector design elements for drawing FTA diagrams (or negative analytical trees), cause and effect diagrams and fault tree diagrams.
Graphics Software for Business
Diagrama de Topologia
Mac Diagramming Software
Cause and Effect Analysis

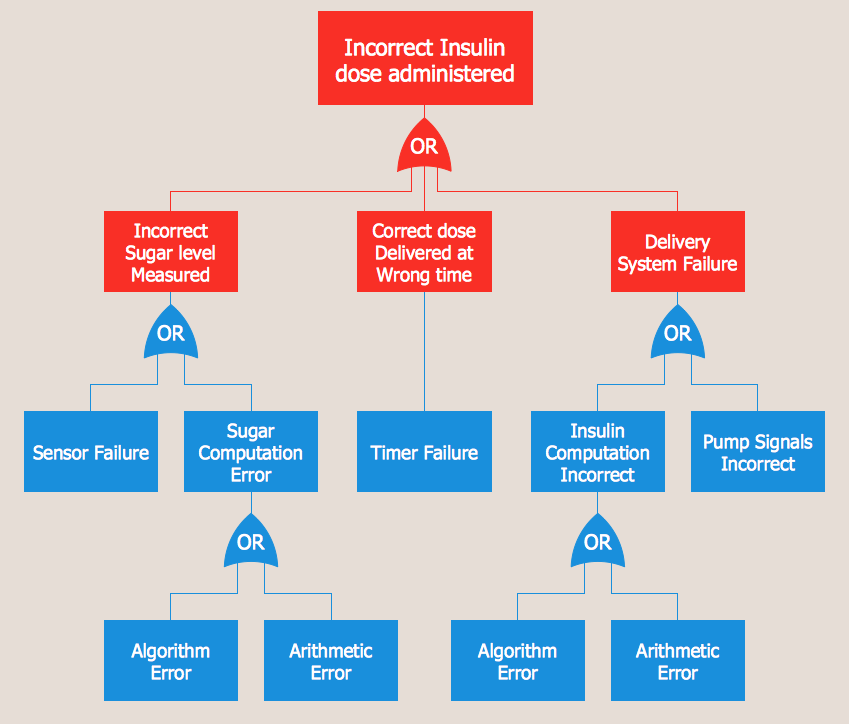
The FTA diagram sample "Fault tree analysis - Insulin delivery system" was redesigned from the illustration of "CMSI 641: Introduction to Software Engineering. Design of Critical Systems. B.J. Johnson. 2005. Loyola Marymount University".
"Another way of assessing hazards is using fault tree analysis. In this process, each of the identified hazards is covered by a detailed analysis to find out what might cause it. Either inductive or deductive reasoning is applied. In the case of software hazards, the usual focus is to determine faults that will cause the system to fail to deliver a system service, such as a monitoring system. A "fault tree" is constructed to link all the possible situations together, to help identify the interrelationships of the failures, which modules may cause them, and what "trickle-down effects" there might be. Here is an example of a fault tree, as applied to the Insulin delivery system from Sommerville...
Note that this tree is only partially complete, since only the potential software faults are shown on the diagram. The potential failures involving hardware, such as low battery, blood monitor or sensor failure, patient over-exertion or inattention, or medical staff failure are noticeable by their absence.
The fault tree and safety specification processes are two ways of helping with system risk assessment tasks. Once the risks are identified, there are other assessments that need to take place. First, the likelihood of the risk occurrance must be assessed. This is often quantifiable, so numbers may be assigned based on things like MTBF, latency effects, and other known entities. There may be other non-quantifiable contributors to the risk likelihood, however, such that these must be assessed and estimated by experts in the domain. (Don't short-change this process when dealing with critical systems!) Finally, the risk assessment must include the severity of the risk, meaning an estimation of the cost to the project in the event the risk item actually does occur. "Cost to the project" means all associated costs, including schedule delays, human injury, damage to hardware, corruption of data, and so on."
[myweb.lmu.edu/ bjohnson/ cmsi641web/ week15-2.html]
The FTA diagram example "Fault tree analysis - Insulin delivery system" was created using the ConceptDraw PRO diagramming and vector drawing software extended with the Fault Tree Analysis Diagrams solution from the Engineering area of ConceptDraw Solution Park.
FTA diagram

ConceptDraw Arrows10 Technology
- Tree Network Topology Diagram | Fully Connected Network ...
- Fault Tree Analysis Software | Project —Task Trees and ...
- Fault Tree Analysis Diagrams | Graphics Software for Business ...
- Fault Tree Analysis Diagrams | Process Flowchart | Fishbone ...
- Fault Tree Diagram Software
- Fault Tree Analysis Diagrams | Fault Tree Analysis Software | Fault ...
- Fault Tree Analysis Software | PROBLEM ANALYSIS. Root Cause ...
- Picture Of A Software Tree In Education
- Tree Diagram Software
- Fault Tree Analysis Software
- Fault Tree Analysis Diagrams | Fault Tree Analysis Software | How to ...
- Fault Tree Analysis Diagrams | Fault Tree Analysis Software | Mac ...
- Fault Tree Analysis Software Free
- Decision tree diagram | Decision Making | Influence Diagram ...
- Fault Tree Analysis Diagrams | Root cause analysis tree diagram ...
- Fishbone Diagram | Fishbone Diagrams | Fault Tree Analysis ...
- Fault Tree Analysis Software | Design elements - Fault tree analysis ...
- Diagramming Software Tree Mode
- Authority Matrix Diagram Software | PROBLEM ANALYSIS. Root ...
- Root cause analysis tree diagram - Template | PROBLEM ...