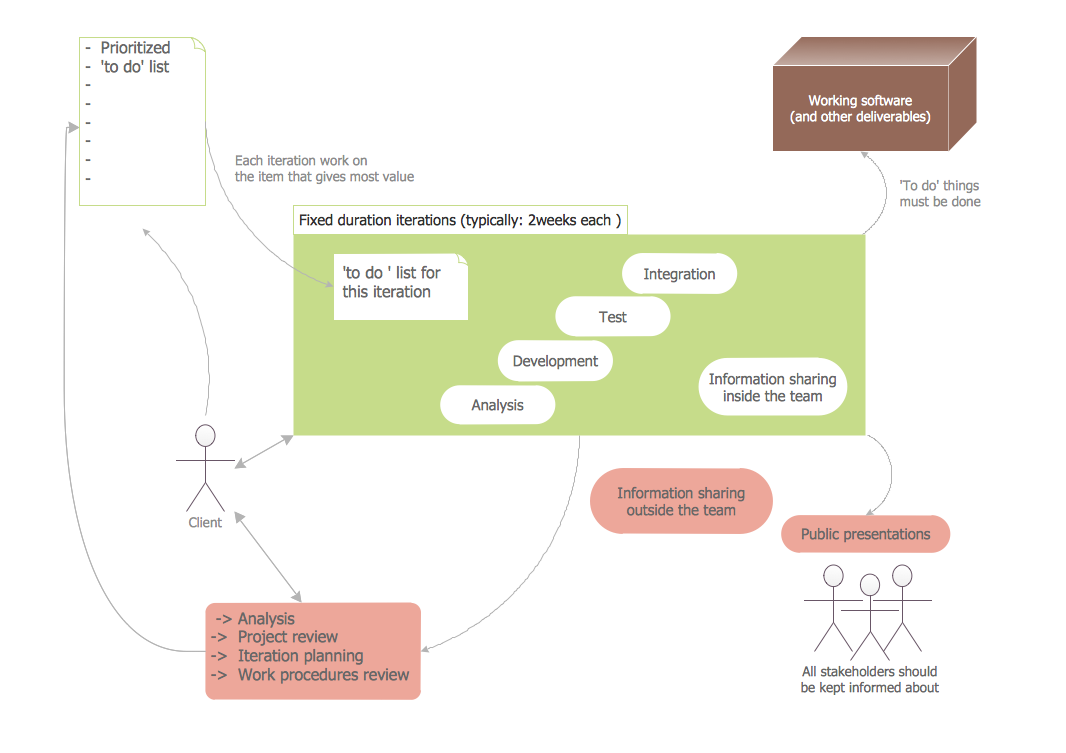
Software Work Flow Process in Project Management with Diagram
This sample was created in ConceptDraw DIAGRAM diagramming and vector drawing software using the Workflow Diagrams Solution from the Software Development area of ConceptDraw Solution Park.This sample shows the Workflow Diagram that clearly illustrates stages a BPM consists of and relations between all parts of business. The Workflow Diagrams are used to represent the transferring of data during the work process, to study and analysis the working processes, and to optimize a workflow.
Software Diagram Examples and Templates
ConceptDraw Pro is a powerful tool for business and technical diagramming. Software Development area of ConceptDraw Solution Park provides 5 solutions: Data Flow Diagrams, Entity-Relationship Diagram (ERD), Graphic User Interface, IDEFO Diagrams, Rapid UML.Software Diagrams
Modern software development begins with designing different software diagrams and also uses a large amount of diagrams in project management and creation graphic documentation. Very popular diagrams that depict a work of applications in various cuts and notations, describe databases and prototype Graphical User Interfaces (GUIs). Software engineering specialists and software designers prefer to use special technical and business graphics tools and applications for easy creation diagrams. One of the most popular is ConceptDraw DIAGRAM diagramming and vector drawing software. ConceptDraw DIAGRAM offers the possibility of drawing with use of wide range of pre-drawn shapes and smart connectors, which allow to focus not on the process of drawing, but on the task's essence. It is a perfect application for design and document development, planning tasks, visualization of data, design the databases, object-oriented design, creation flowcharts of algorithms, modeling business processes, project management, automation of management and development processes, and for many other tasks.Simple & Fast Diagram Software
It is so simple making the drawing process easier and faster. you just need to choose the right drawing software. ConceptDraw Arrows10 Technology - This is so easy and fast to draw any type of diagram with any degree of complexity.
Entity Relationship Diagram Software Engineering
Entity Relationship Diagram (aka ER Diagram, E-R Diagram, ERD) is a time-tested and widespread software development and software engineering method for data modeling, illustrating the logical structure of databases and system design. For ERDs construction are used three basic elements: entities, attributes, and relationships. Chen's notation for ERD supposes the use of rectangles (boxes) to represent entities and diamonds to depict relationships between first-class objects. This notation is popular when creating conceptual data models of information systems. Another standardized notation for ER diagrams is Crow's foot notation. ConceptDraw DIAGRAM as a powerful Entity Relationship Diagram software engineering provides the tools of Entity-Relationship Diagram (ERD) solution from Software Development area of ConceptDraw Solution Park for instantly describing databases using ERDs of Crow’s Foot and Chen’s notations. Use the predesigned vector elements for both these notations from 2 libraries included to Entity-Relationship Diagram (ERD) solution.ConceptDraw PROJECT Project Management Software Tool
ConceptDraw PROJECT is simple project management software. If you are on the fast track in your career and start facing such challenges as coordination many people, coordination tasks and works, manage project with a great deal of time and money involved - it is the right time to get Project management tool involved in your work.Pyramid Diagram
The Project Management Triangle Diagram depicts three main constraints of any project: scope, time and cost. Projects have to comply with the specified scope, projects should be finished in time and projects need to consume the budget. Each of the constraints represents one side of the triangle, and any change in budget or timing or scope affects the entire diagram. This diagram was made using ConceptDraw Office suite including best marketing project management software extended with collection of tools for creative project management software and project management reporting software symbols.ConceptDraw PROJECT Software Overview
ConceptDraw PROJECT is an effective tool for new and experienced users with a fine balance of usability and powerful functionality.Software Diagram Templates
Use Software Diagram Templates from the solutions of Software Development area for ConceptDraw DIAGRAM to create your own professional looking Software Diagrams in minutes. The Software Diagrams designed with ConceptDraw DIAGRAM are vector graphic documents and are available for reviewing, modifying, converting to a variety of formats (image, HTML, PDF file, MS PowerPoint Presentation, Adobe Flash or MS Visio XML), printing and send via e-mail in one moment.Basic Diagramming
Block diagrams are essentially a very simple format of diagrams. A variety of commonly used shapes and connecting lines, rules of construction and actions pertaining to them, make Block diagram a versatile and flexible tool for many forms of industry. Another advantage is the ease with which Block diagrams can be constructed, especially if you use professional diagramming software. ConceptDraw DIAGRAM software is an example of purpose built application designed with the form of process modeling in mind. It includes Block Diagrams solution from Diagrams area of ConceptDraw Solution Park for easy drawing professional-looking simple diagram - Block diagram, and a lot of other useful solutions for designing variety of other types of diagrams, schematics and flowcharts (Line graphs, Bar charts, Organizational charts, Histograms, Pie charts, Process flowcharts, Fault tree analysis diagrams, Scatter plots, Venn diagrams, Bubble diagrams, etc.). The RapidDraw functionality of ConceptDraw DIAGRAM lets create new objects and their connectors in just single-click.
- Software Project Management Uml Diagrams
- Block Diagram Of Software Project Management
- Software Work Flow Process in Project Management with Diagram ...
- UML Activity Diagram | Diagramming Software for Design UML ...
- Activities In A Project Management Software With Example Diagram
- Gantt charts for planning and scheduling projects | How To Create ...
- Gantt charts for planning and scheduling projects | ConceptDraw ...
- Systems development life cycle | SSADM Diagram | Process ...
- Project Management Diagrams
- Project Network Diagram Example Of Software Project


