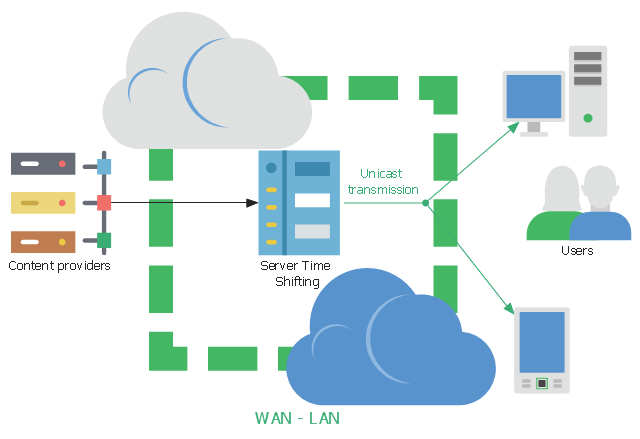
This network diagram sample shows the video on demand (VoD) architecture in a network video recorder (NVR) enviroment. It was designed on the base of Wikimedia Commons file: BaixdemandaArchitecture.png.
[commons.wikimedia.org/ wiki/ File:BaixdemandaArchitecture.png]
This file is licensed under the Creative Commons Attribution-Share Alike 3.0 Unported license. [creativecommons.org/ licenses/ by-sa/ 3.0/ deed.en]
"Video on demand (display) (VOD) are systems which allow users to select and watch/ listen to video or audio content when they choose to, rather than having to watch at a specific broadcast time. IPTV technology is often used to bring video on demand to televisions and personal computers." [Video on demand. Wikipedia]
The network diagram example "VoD architecture in a NVR enviroment" was created using the ConceptDraw PRO diagramming and vector drawing software extended with the Computers and
Communications solution from the Illustration area of ConceptDraw Solution Park.
Network diagram
Business and Finance Illustrations Example

 iPhone User Interface
iPhone User Interface solution extends ConceptDraw DIAGRAM software with templates, samples and libraries with large quantity of vector stencils of graphical user interface elements, Apps icons, UI patterns for designing and prototyping of the iOS applic
Android UI Design
This wheel diagram sample was created on the base of figure illustrating the webpage "Chapter 3: Current State of the Ecosystem" of the website of the National Broadband Plan of US Federal Communications Comission (FCC). "The broadband ecosystem includes applications and content: e-mail, search, news, maps, sales and marketing applications used by businesses, user-generated video and hundreds of thousands of more specialized uses. Ultimately, the value of broadband is realized when it delivers useful applications and content to end-users.
Applications run on devices that attach to the network and allow users to communicate: computers, smartphones, set-top boxes, e-book readers, sensors, private branch exchanges (PBX), local area network routers, modems and an ever-growing list of other devices. New devices mean new opportunities for applications and content.
Finally, broadband networks can take multiple forms: wired or wireless, fixed or mobile, terrestrial or satellite. Different types of networks have different capabilities, benefits and costs.
The value of being connected to the network increases as more people and businesses choose to adopt broadband and use applications and devices that the network supports. Several factors contribute to their decisions. These include whether they can afford a connection, whether they are comfortable with digital technology and whether they believe broadband is useful.
Networks, devices and applications drive each other in a virtuous cycle. If networks are fast, reliable and widely available, companies produce more powerful, more capable devices to connect to those networks. These devices, in turn, encourage innovators and entrepreneurs to develop exciting applications and content. These new applications draw interest among end-users, bring new users online and increase use among those who already subscribe to broadband services. This growth in the broadband ecosystem reinforces the cycle, encouraging service providers to boost the speed, functionality and reach of their networks."
[broadband.gov/ plan/ 3-current-state-of-the-ecosystem/ ]
The circle pie chart example "Forces shaping the broadband ecosystem in the US" was created using the ConceptDraw PRO diagramming and vector drawing software extended with the Target and Circular Diagrams solution from the Marketing area of ConceptDraw Solution Park.
www.conceptdraw.com/ solution-park/ marketing-target-and-circular-diagrams
Wheel diagram

Organizational Structure Types

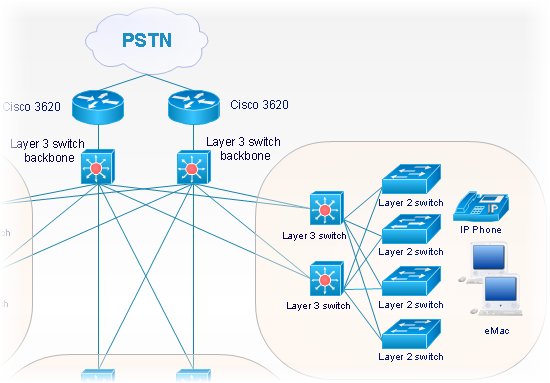
Metropolitan area networks (MAN). Computer and Network Examples
. Computer and Network Examples")

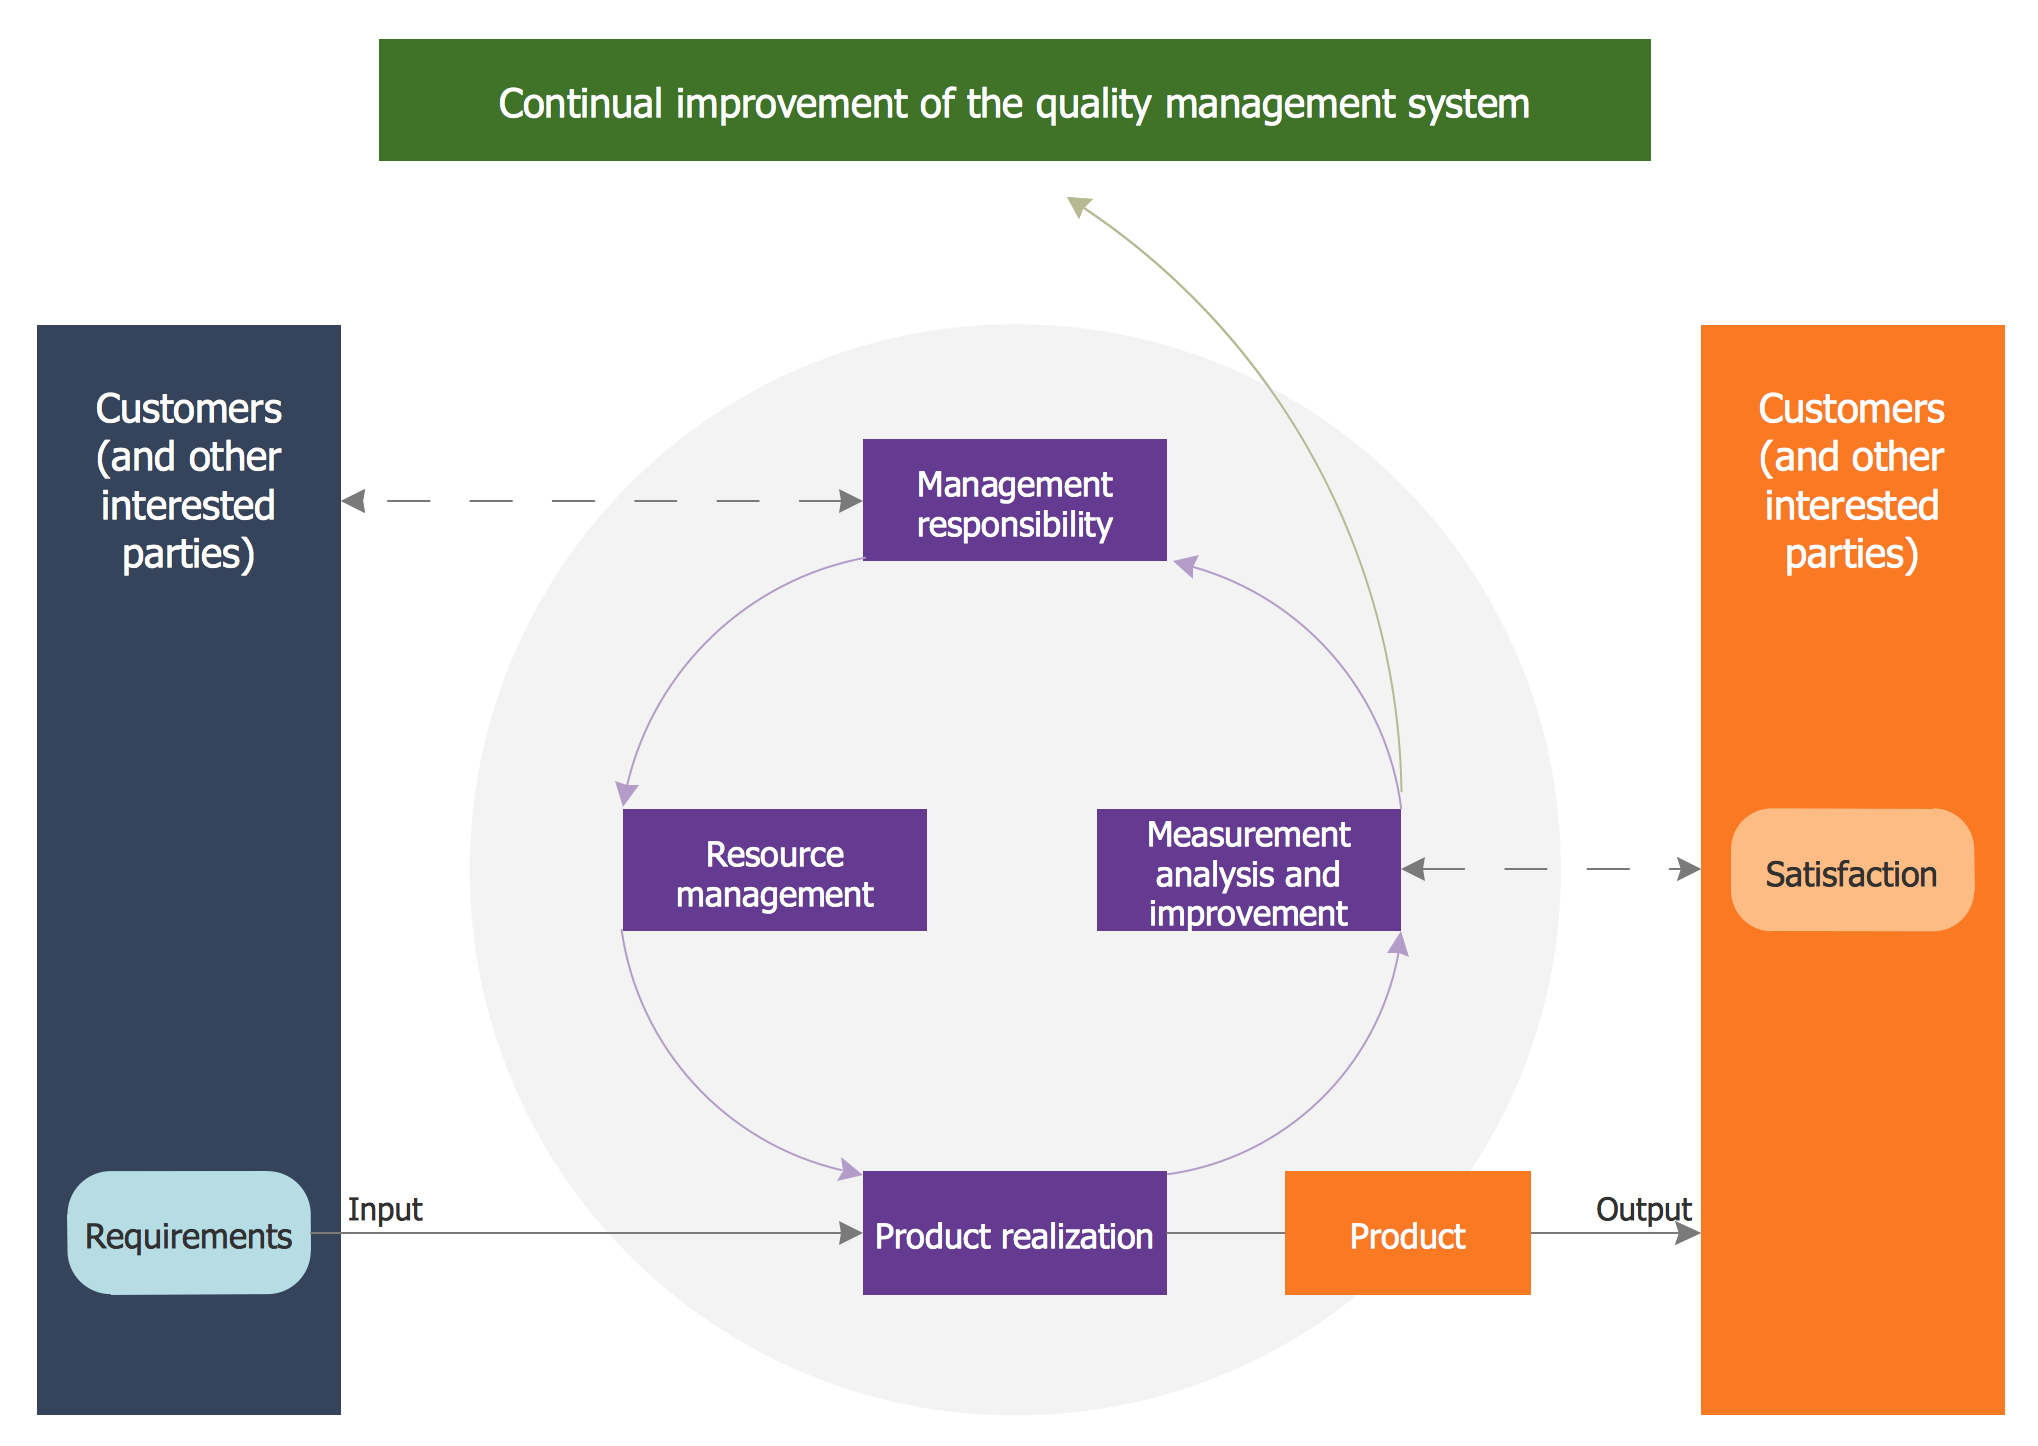
Quality Management System
HelpDesk
How to Create Digital Media Infographics

Basic Network Diagram

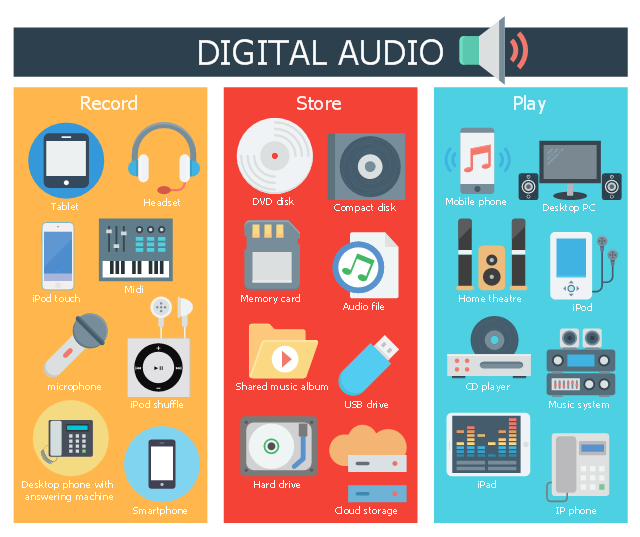
This infographic sample shows digital audio devices for record, store and play of sound and music.
"Digital audio is technology that can be used to record, store, generate, manipulate, and reproduce sound using audio signals that have been encoded in digital form. Following significant advances in digital audio technology during the 1970s, it gradually replaced analog audio technology in many areas of sound production, sound recording (tape systems were replaced with digital recording systems), sound engineering and telecommunications in the 1990s and 2000s." [Digital audio. Wikipedia]
The infographic example "Digital audio" was created using the ConceptDraw PRO diagramming and vector drawing software extended with the Audio, Video, Media solution from the Illustrations area of ConceptDraw Solution Park.
Infographic
 Wireless Networks
The Wireless Networks Solution extends ConceptDraw DIAGRAM software with professional diagramming tools, set of wireless network diagram templates and samples, comprehensive library of wireless communications and WLAN objects to help network engineers and designers efficiently design and create Wireless network diagrams that illustrate wireless networks of any speed and complexity, and help to identify all required equipment for construction and updating wireless networks, and calculating their costs.
 Infographics Area
Solutions of the area What is Infographics from ConceptDraw Solution Park collect templates, samples and vector stencils libraries with design elements for the drawing information graphics.
Cisco Network Objects in ConceptDraw DIAGRAM
Cisco Network Examples and Templates
- Png Smartphone Vector Hd
- Smartphone Icon Vector Screen Template
- Visio Smartphone Icon
- Smartphone Network Diagram
- Icon Smartphone Android
- Diagram Smartphone
- Smartphone
- Basic computer network diagram | Network topologies diagram | Bus ...
- Visio Smartphone Icon With White Background
- Android Ui Designer Software
- Android Ui Design Software
- Visio Stencil Smartphone Free
- Android Software Ui Design
- Local area network (LAN). Computer and Network Examples ...
- Why People Select ConceptDraw MINDMAP | Entity-Relationship ...
- Presentation Clipart | Business People Clipart | Arrows - Vector ...
- Design elements - Scrum people | Cloud round icons - Vector ...
- Android UI Design Tool | Android User Interface | How to Design an ...
- People Pc
- Smartphone Notification Icon