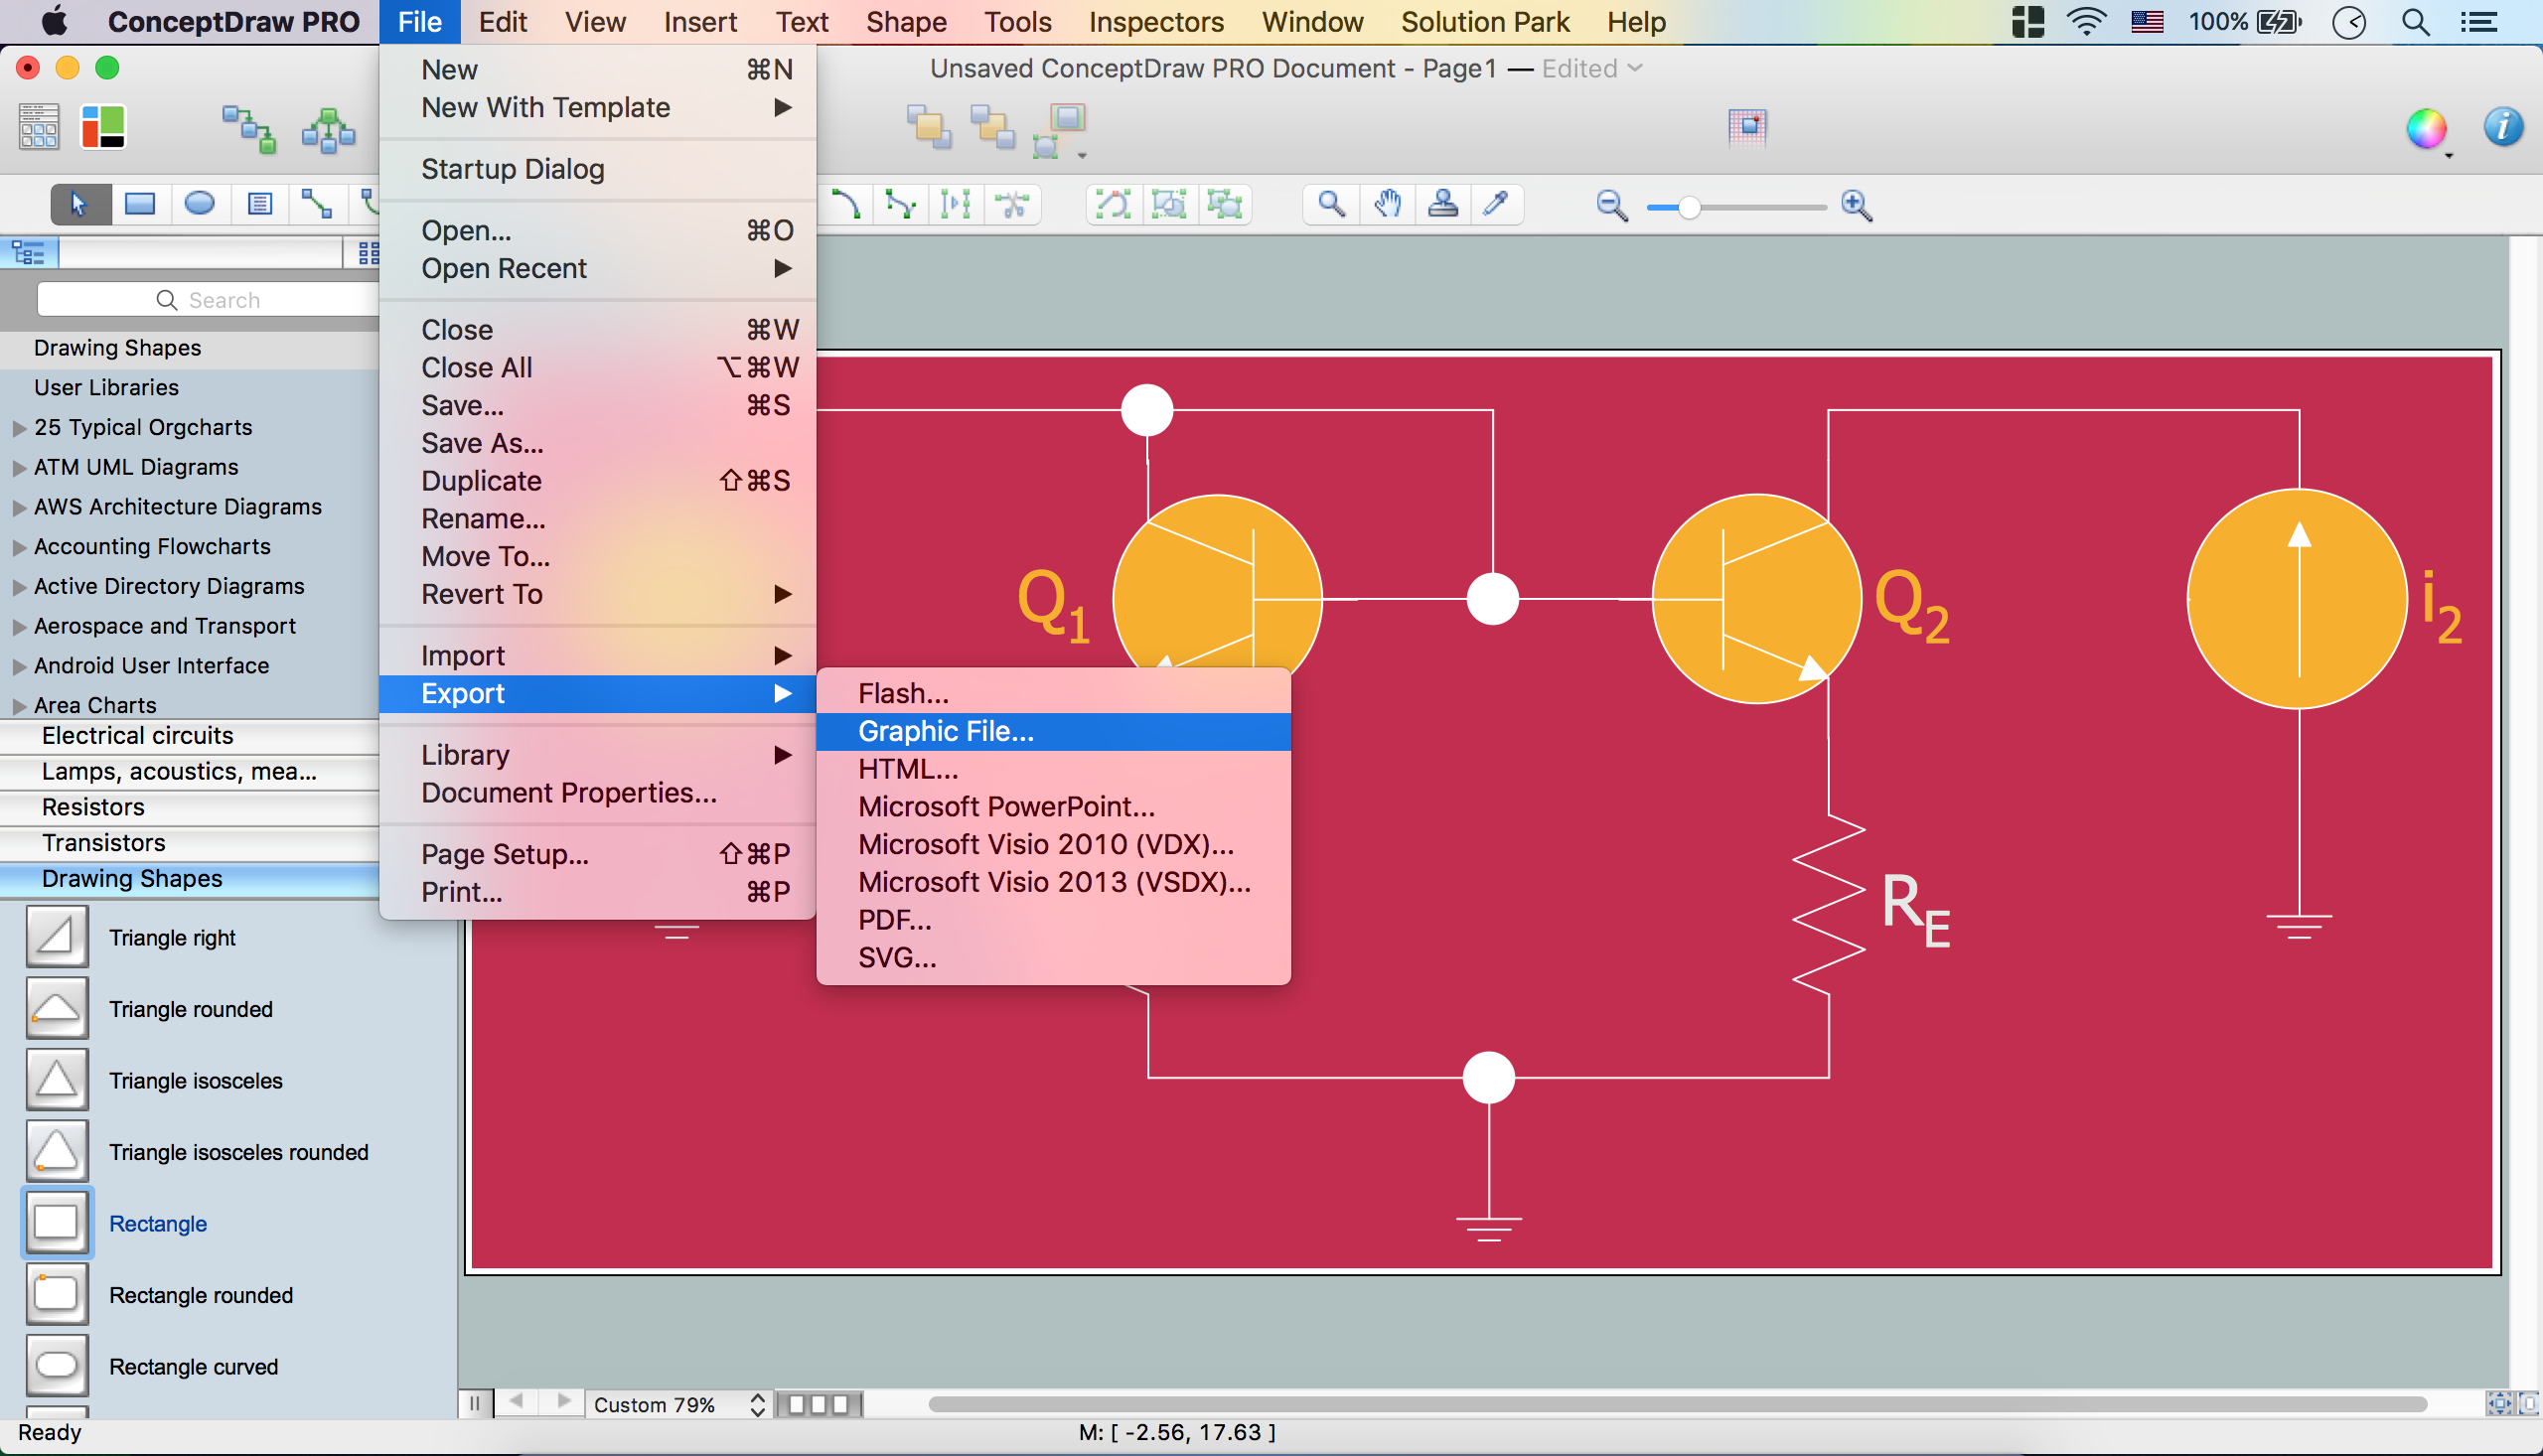
Electrical Diagram Software

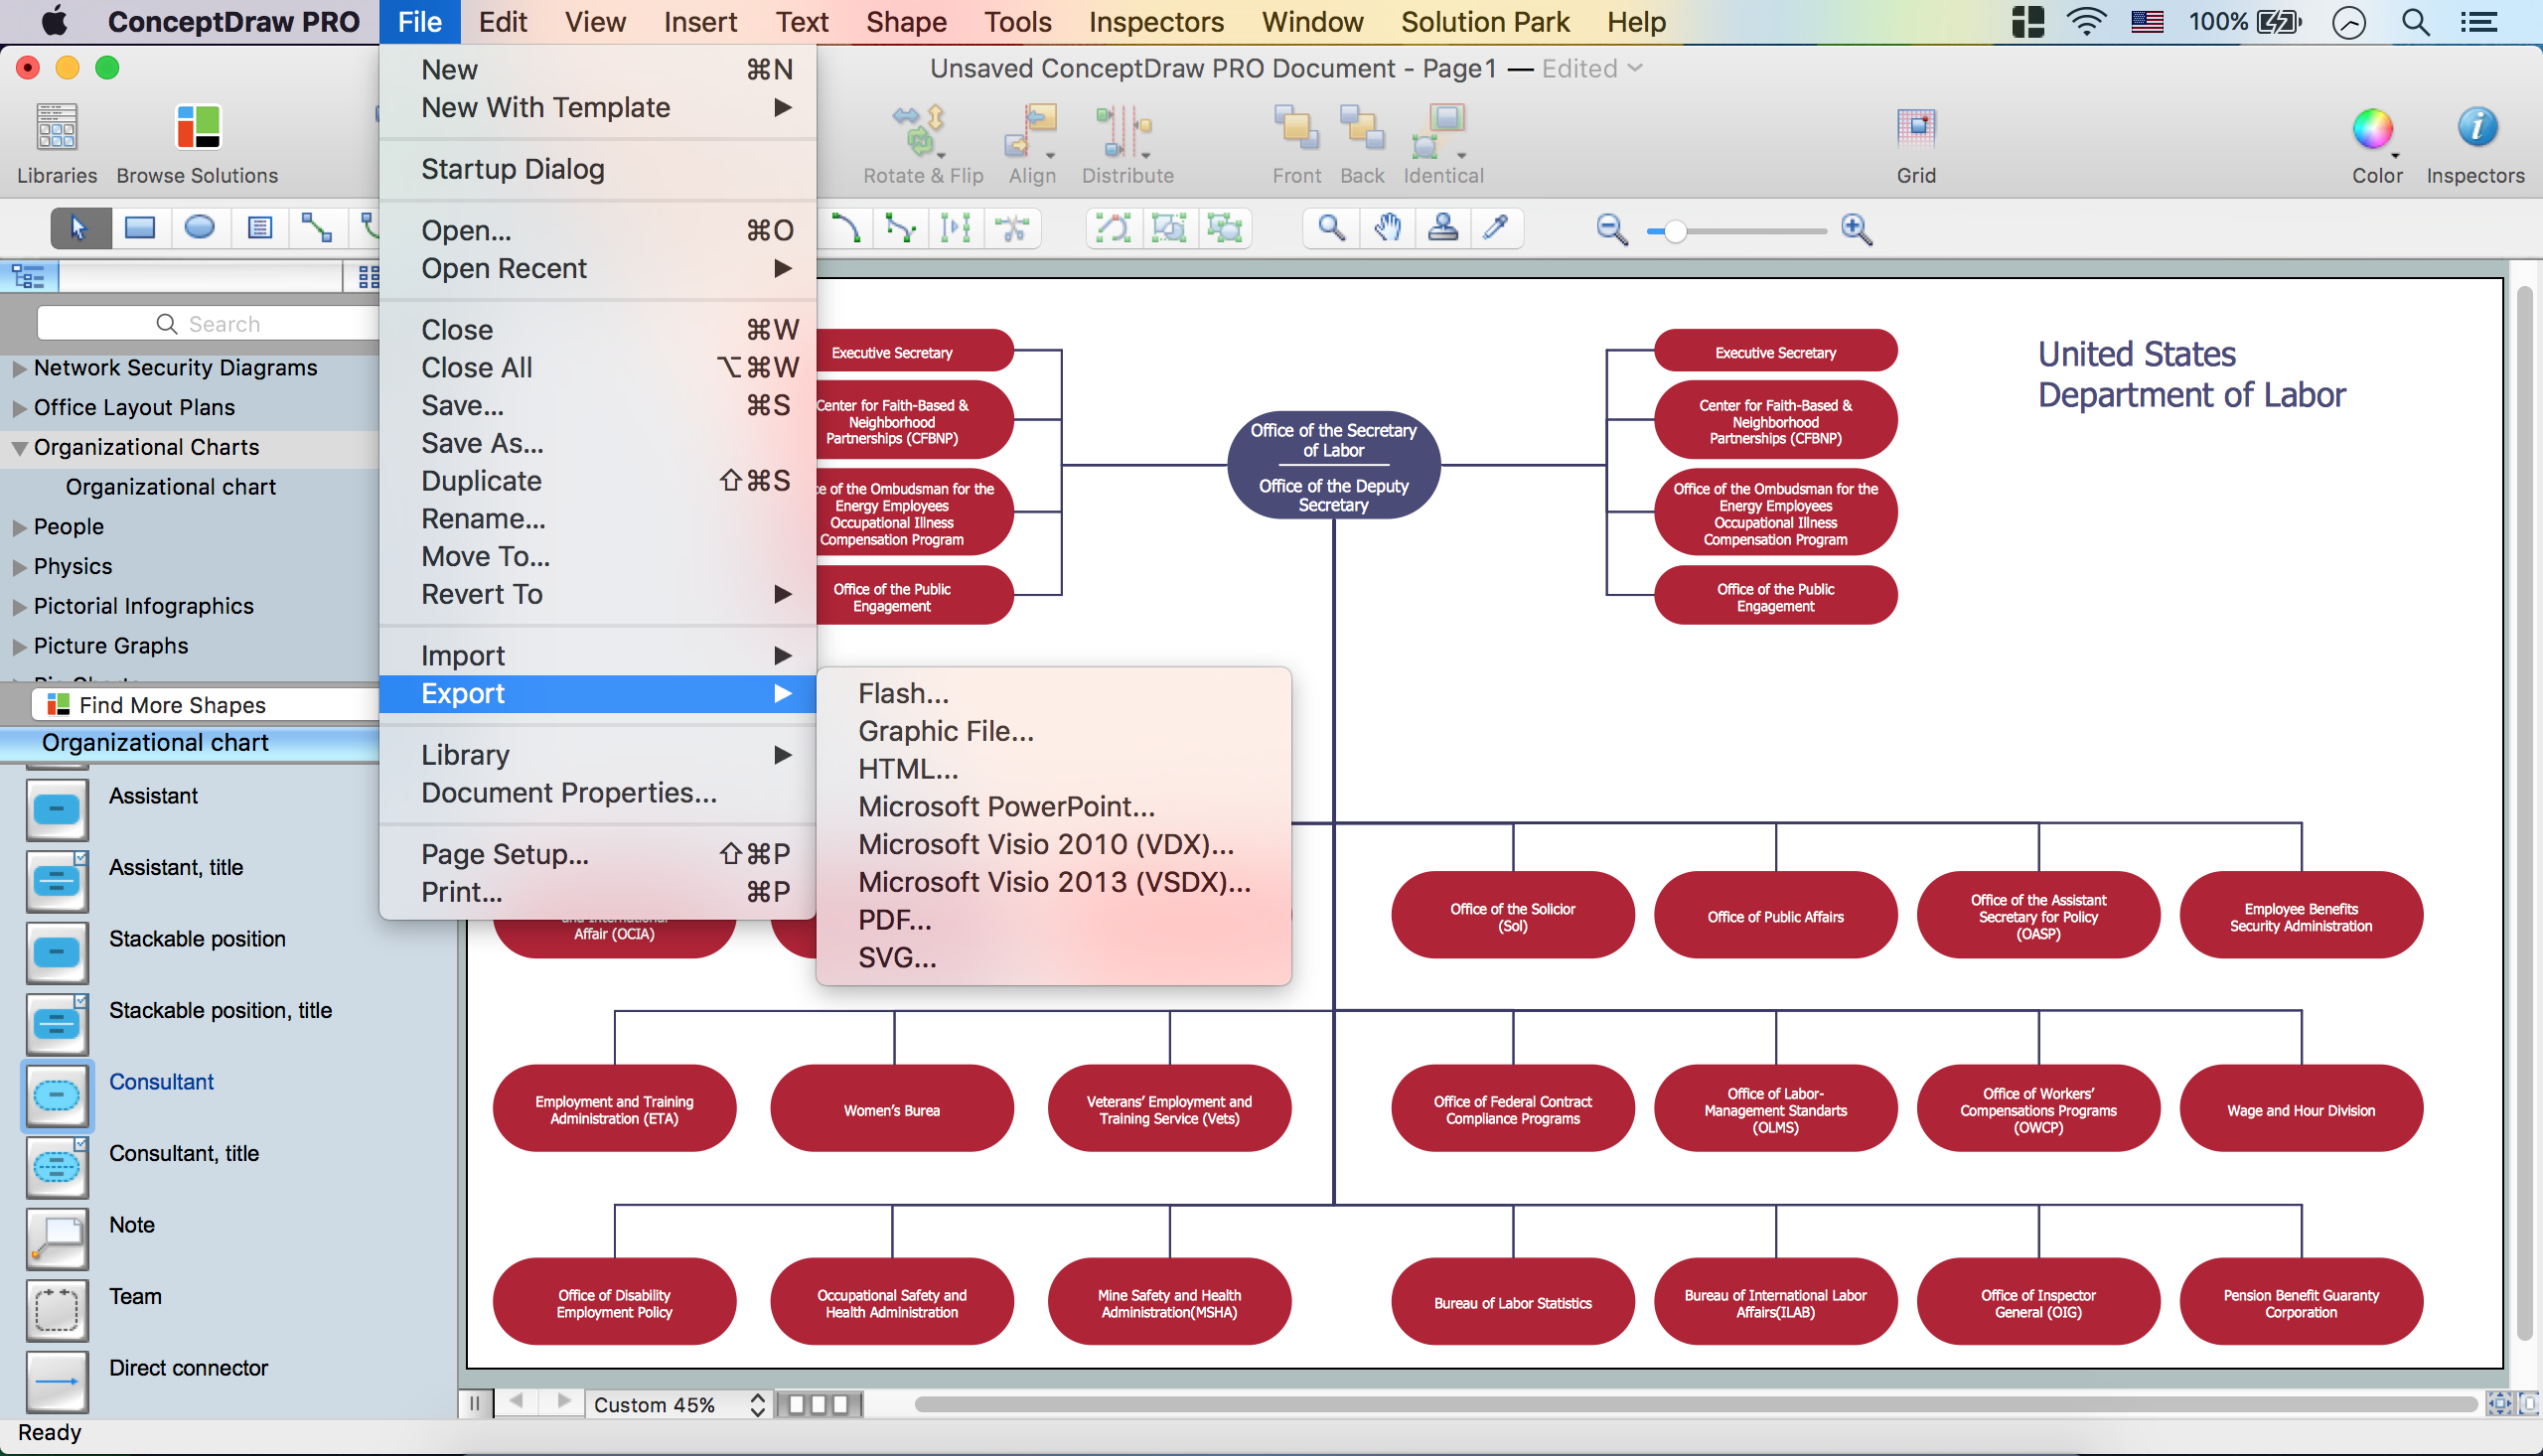
Create Organizational Chart
HelpDesk
How to Set Line Jumps for Smart Connectors in ConceptDraw DIAGRAM

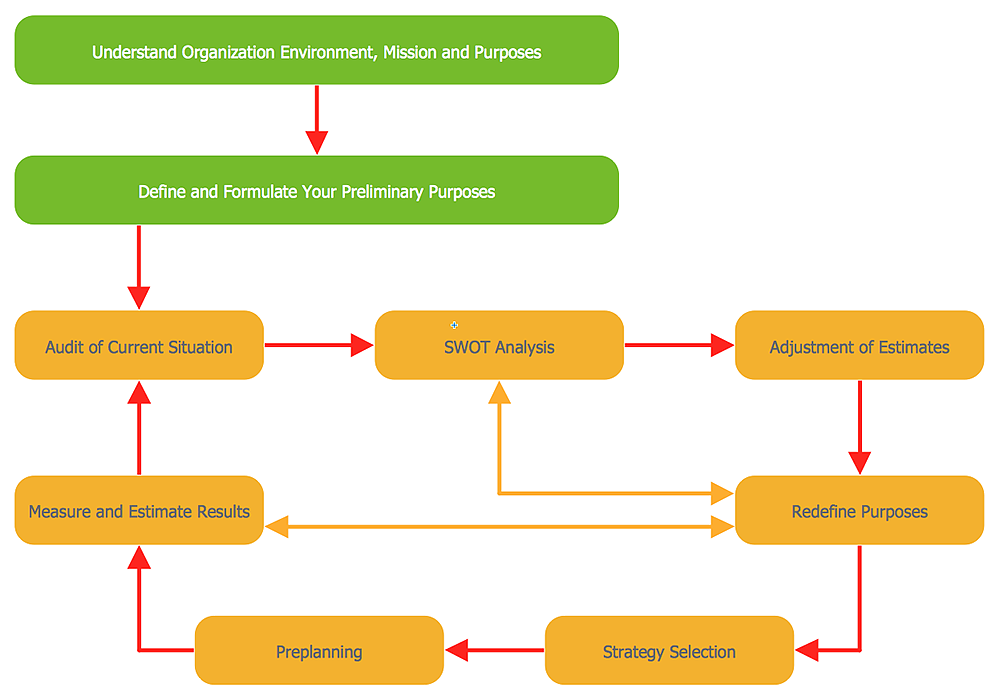
Affinity Diagram

HelpDesk
How to Start Drawing a Diagram on Mac
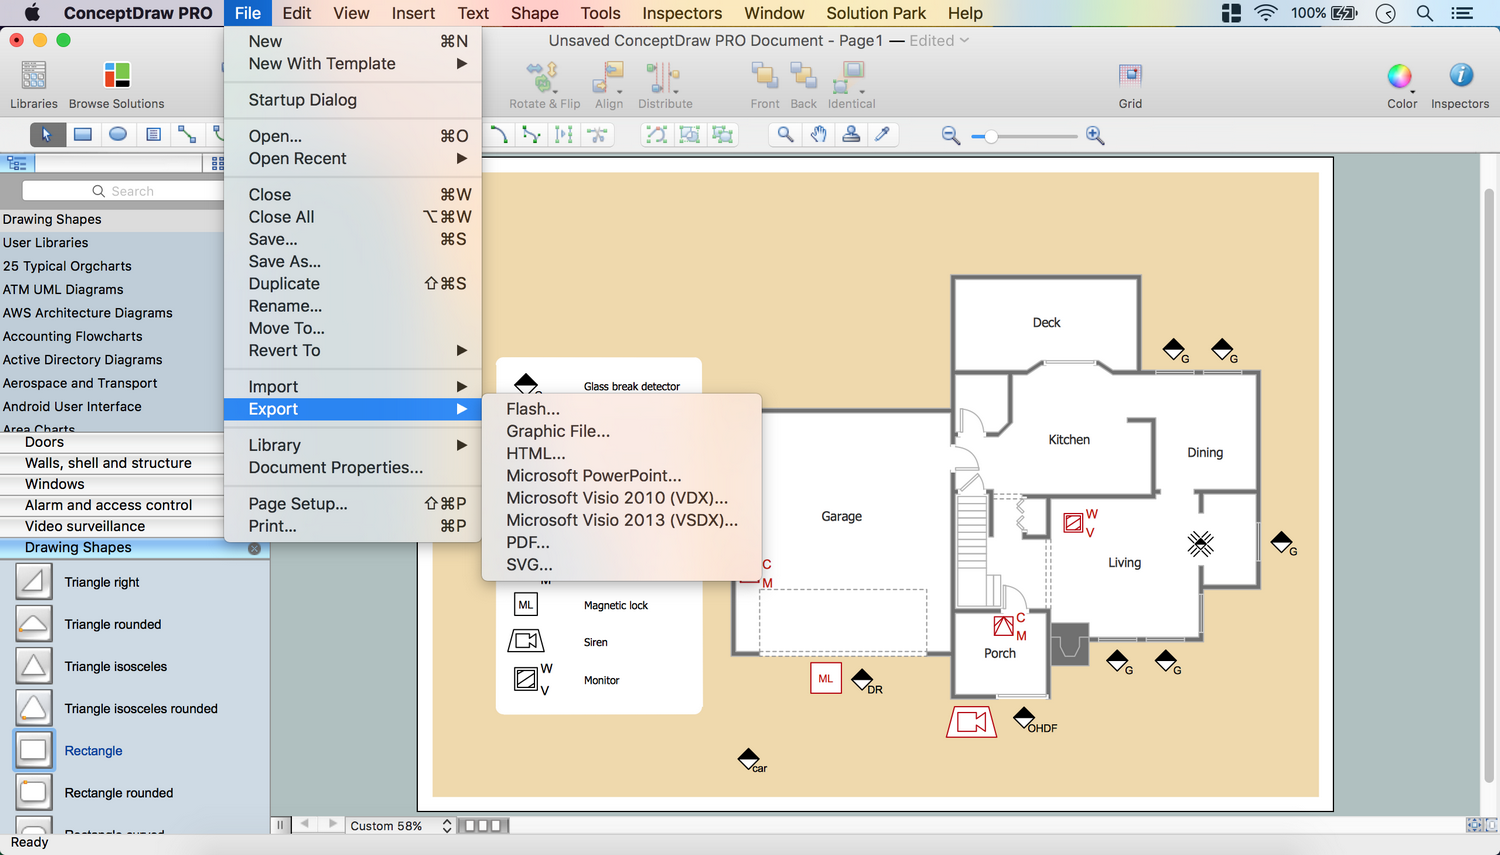
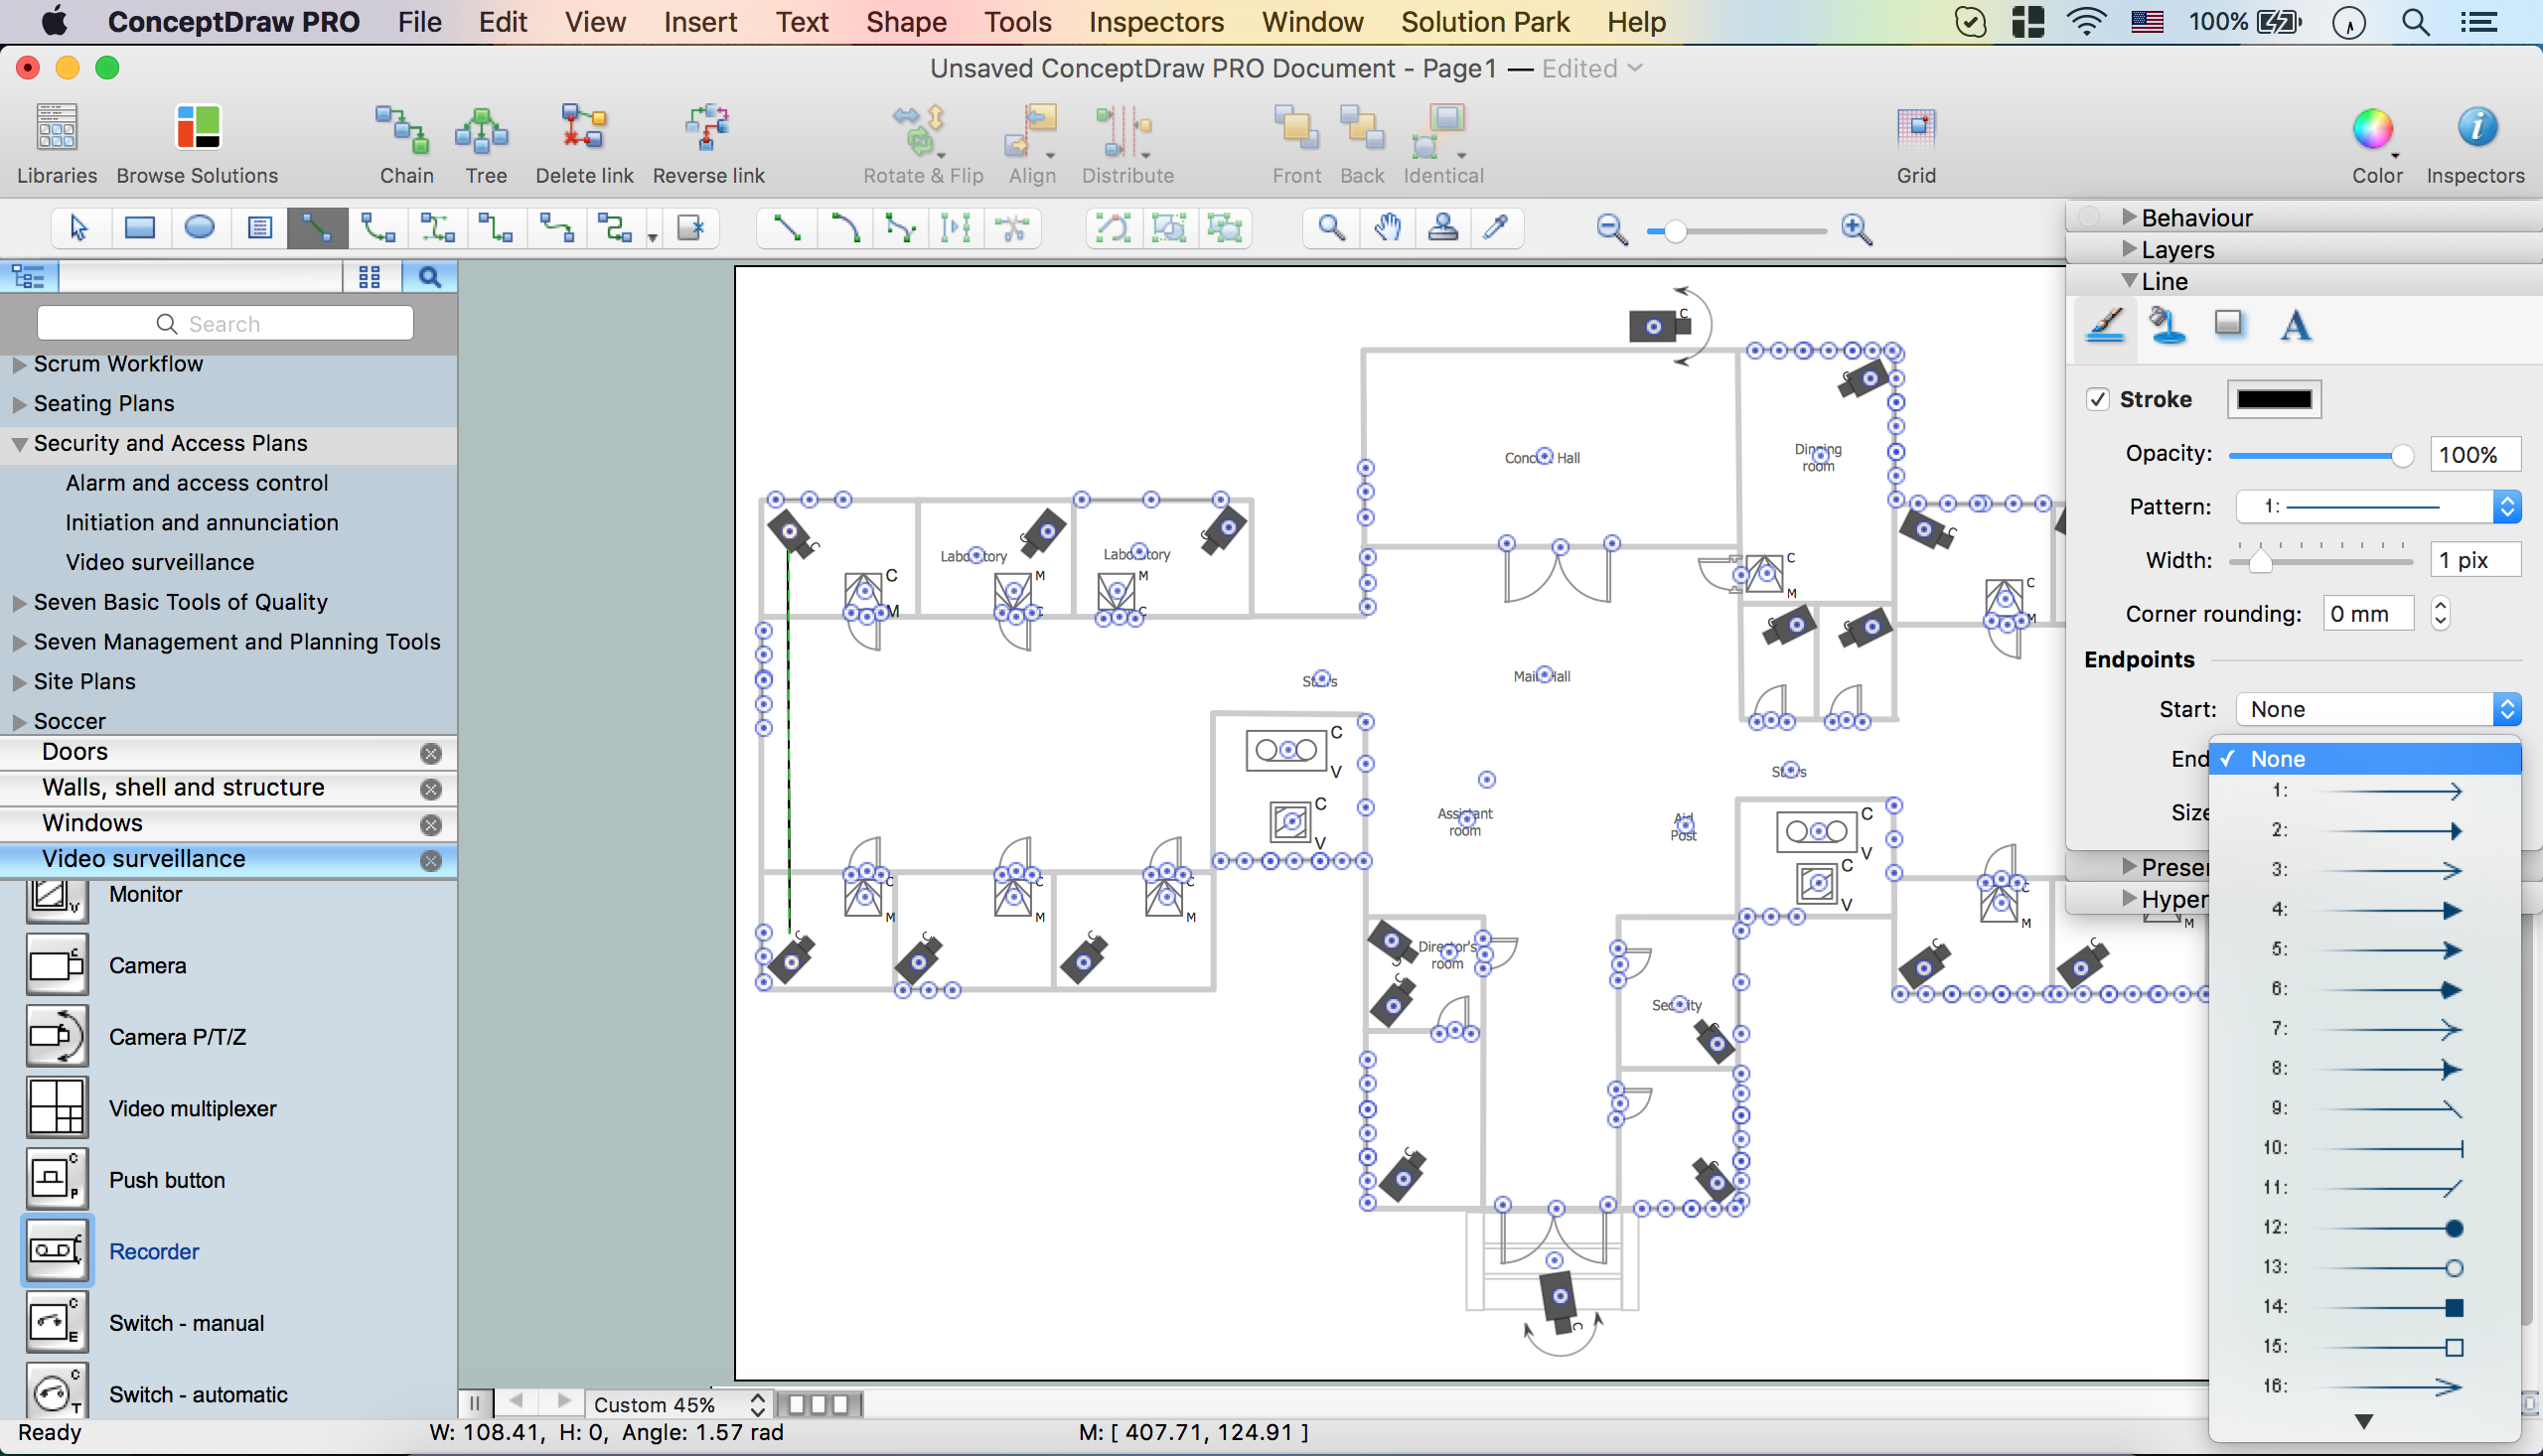
Security Plans
 Computer Network Diagrams
Computer Network Diagrams solution extends ConceptDraw DIAGRAM software with samples, templates and libraries of vector icons and objects of computer network devices and network components to help you create professional-looking Computer Network Diagrams, to plan simple home networks and complex computer network configurations for large buildings, to represent their schemes in a comprehensible graphical view, to document computer networks configurations, to depict the interactions between network's components, the used protocols and topologies, to represent physical and logical network structures, to compare visually different topologies and to depict their combinations, to represent in details the network structure with help of schemes, to study and analyze the network configurations, to communicate effectively to engineers, stakeholders and end-users, to track network working and troubleshoot, if necessary.
 Bubble Diagrams
Bubble diagrams have enjoyed great success in software engineering, architecture, economics, medicine, landscape design, scientific and educational process, for ideas organization during brainstorming, for making business illustrations, presentations, planning, design, and strategy development. They are popular because of their simplicity and their powerful visual communication attributes.
How To Create CCTV Network Diagram
- How to Add Text to a Connector in ConceptDraw PRO | Controls ...
- How to Add Text to a Connector in ConceptDraw PRO | DroidDia ...
- Sales Flowcharts | Business Process Diagrams | Controls - Vector ...
- Design elements - Text blocks | Design elements - Stakeholder ...
- ConceptDraw MINDMAP Complete With Video Tutorial Product News
- Design elements - Windows 8 UI | Design elements - Android UI ...
- Eisenhower box | IDEF0 diagram - Inter-box connections | VoIP call ...
- How to Add Text to a Connector in ConceptDraw PRO | Process ...
- Events - Vector stencils library
- Mobile and Phones - Vector stencils library | IVR mobile - Vector ...