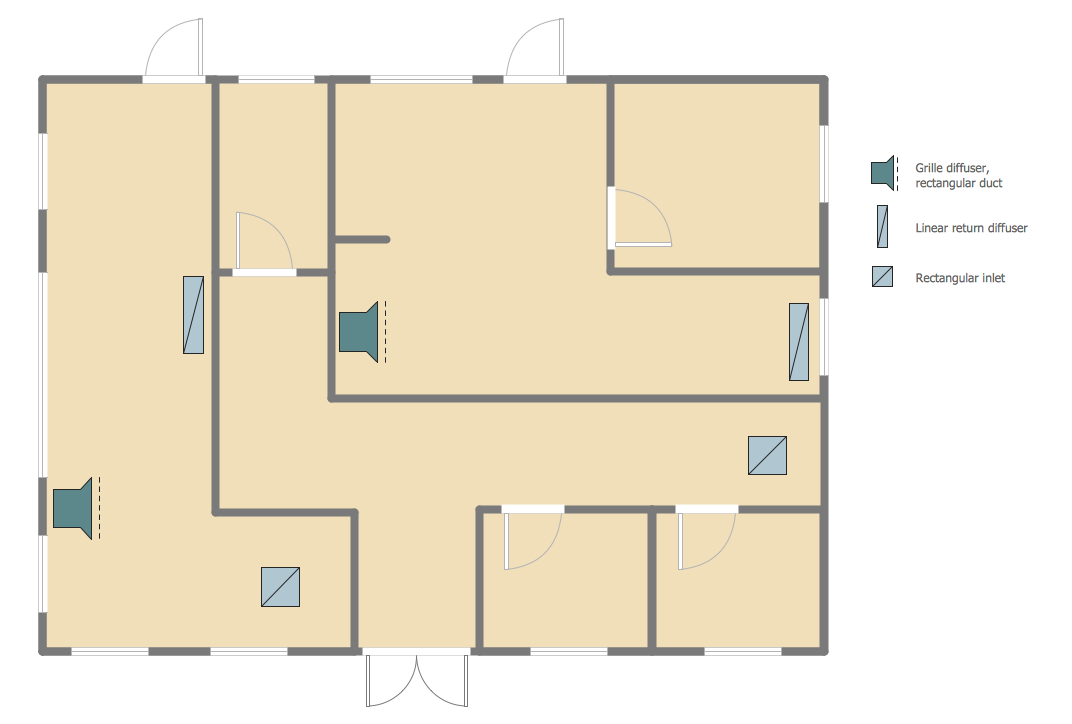
Reflective Ceiling Plan
Account Flowchart. Flowchart Examples

Bar Diagram Math

 HR Flowcharts
Human resource management diagrams show recruitment models, the hiring process and human resource development of human resources.
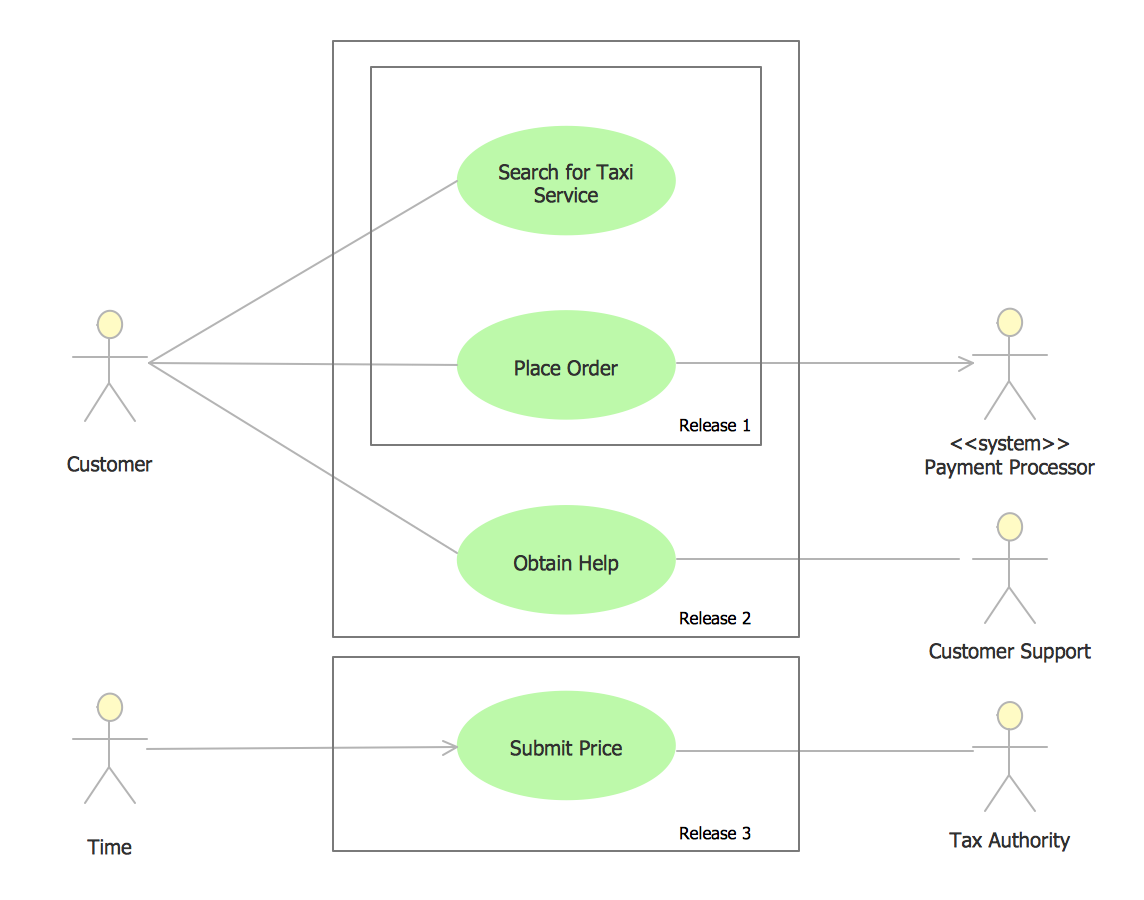
UML Use Case Diagram Example - Taxi Service
Garrett IA Diagrams with ConceptDraw DIAGRAM

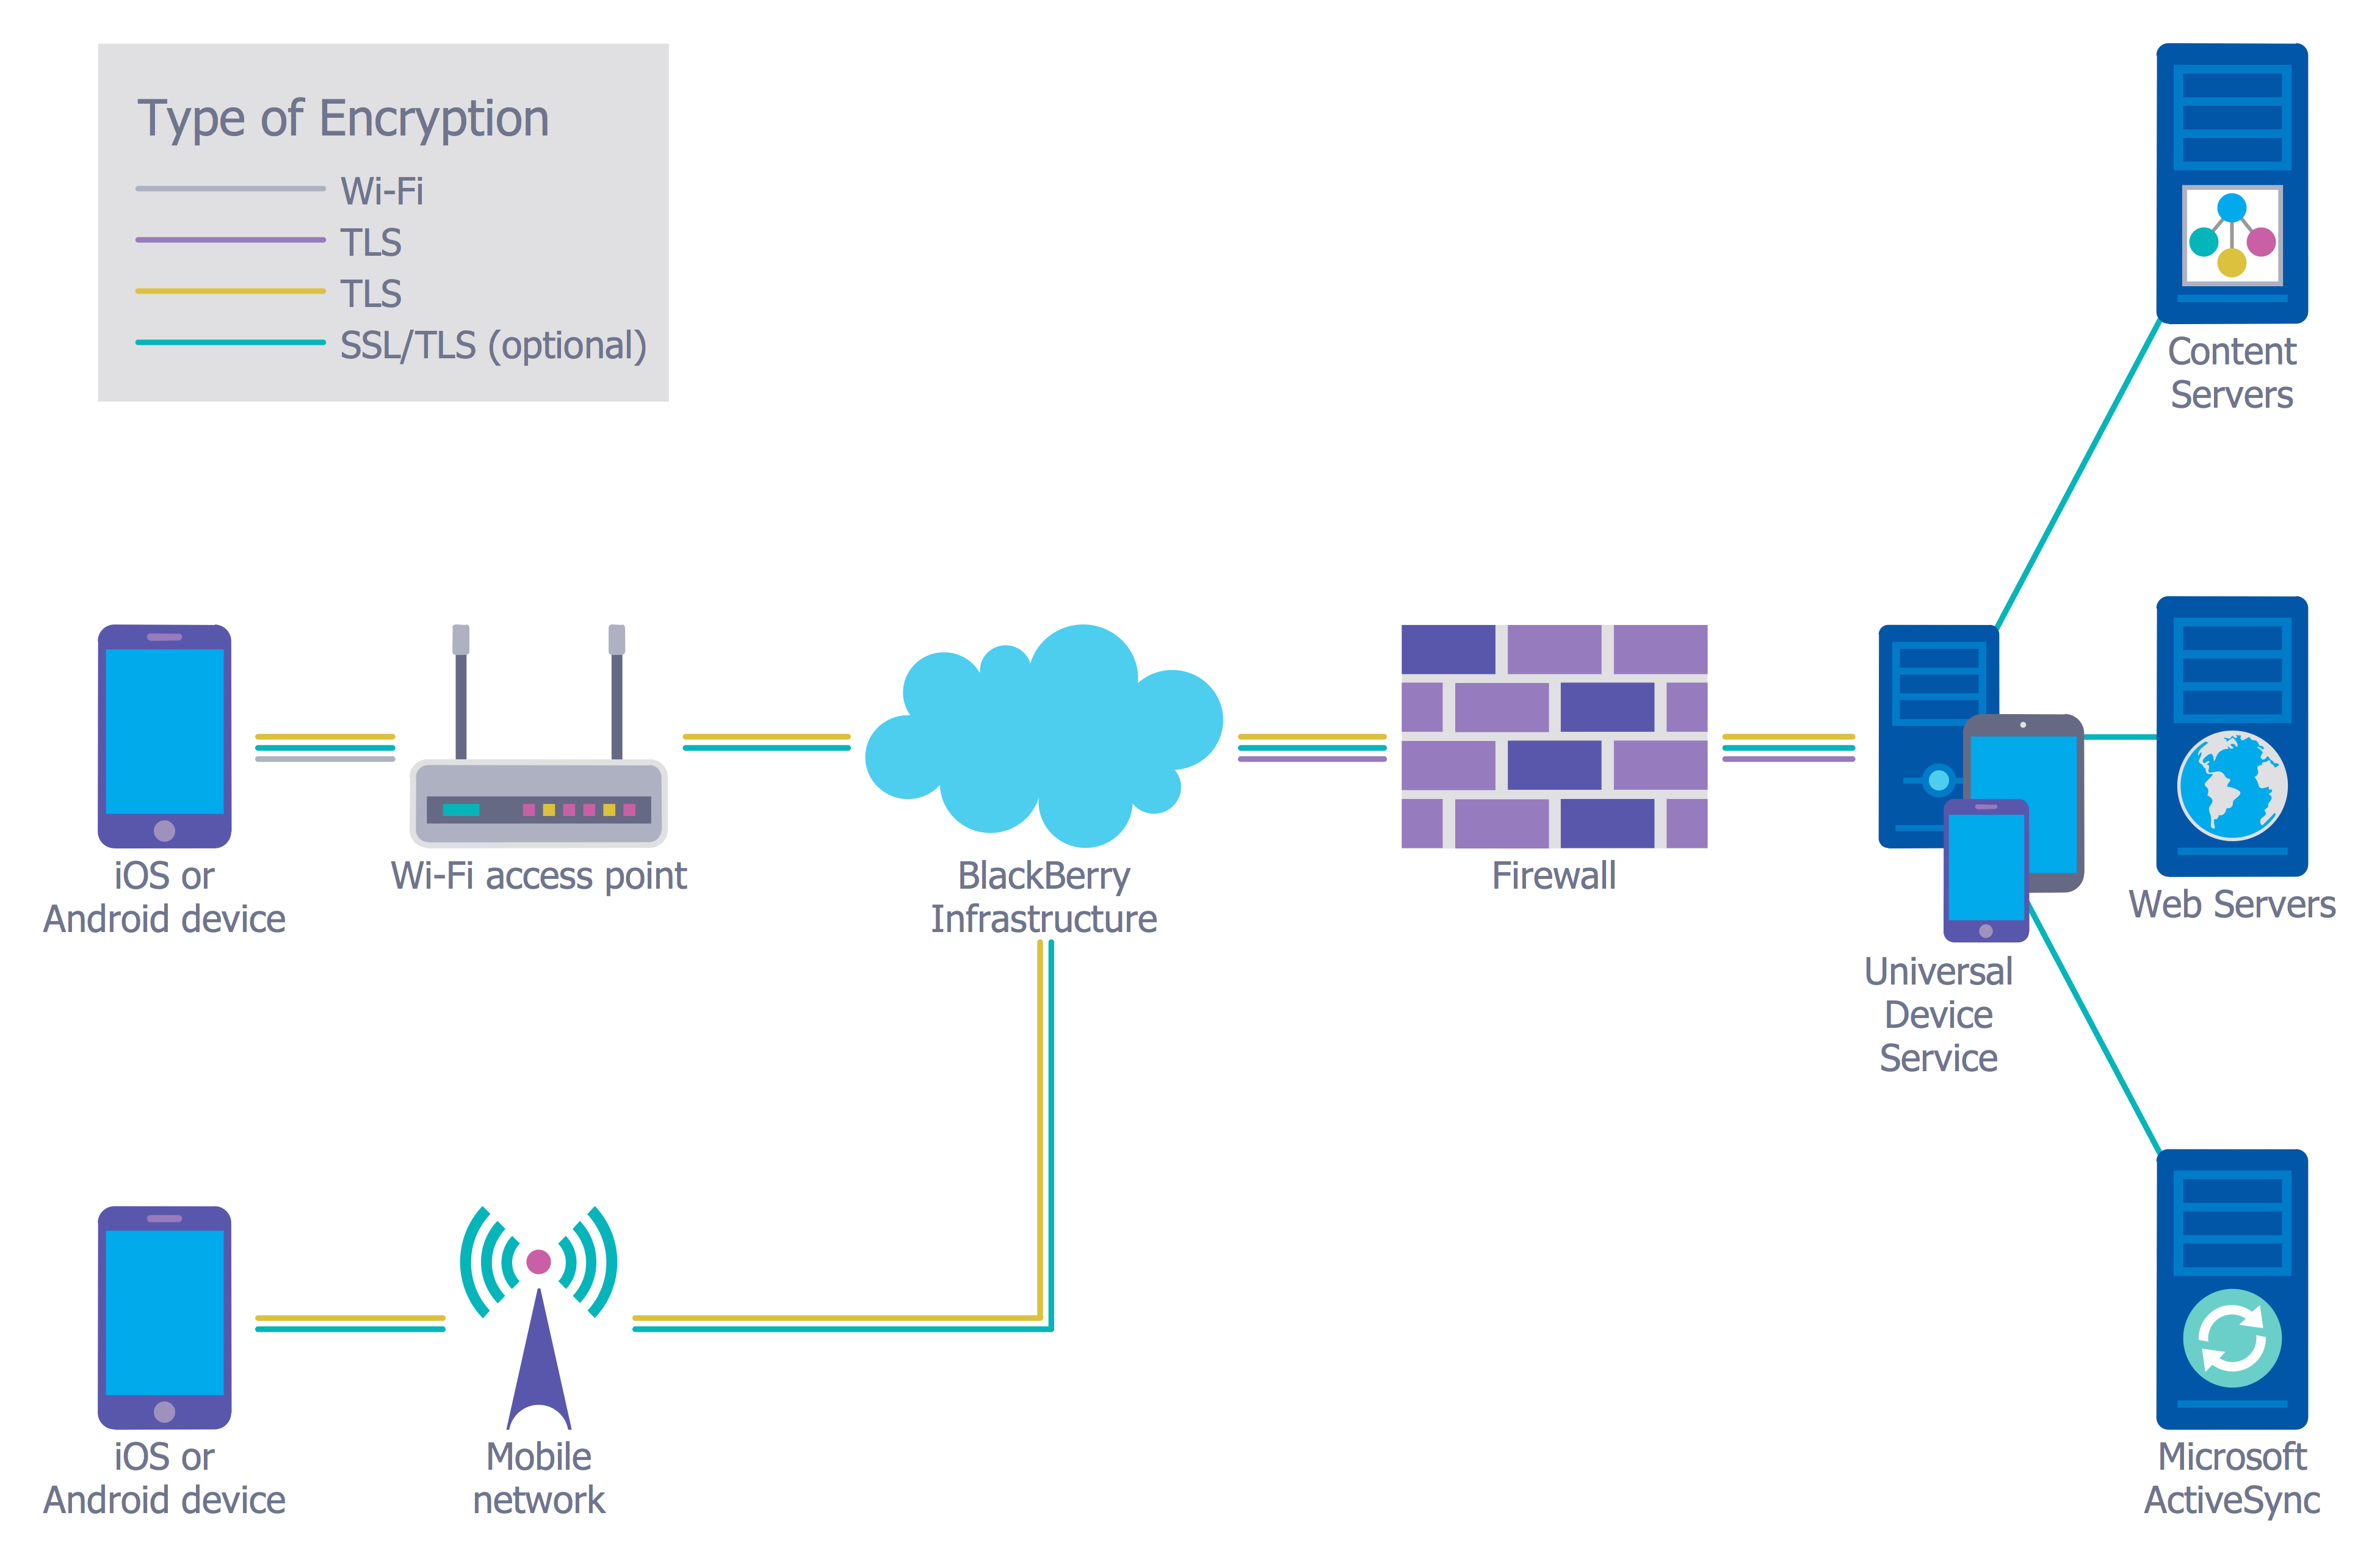
Network Security
Infographic Maker

Flowchart

Design Pictorial Infographics. Design Infographics

- Equipment Maintenance Log Template Excel
- Watercraft - Vector stencils library | Aerospace and Transport ...
- Shipping Truck Vector
- Watercraft - Vector stencils library | Interior Design Shipping and ...
- Flowchart Of Using Pay Phone
- HR steps - Vector stencils library
- Shipping Cart Png
- Job Interview Png
- Shipping Vessel Png
- US Navy shore establishment - Org chart | Watercraft - Vector ...