ERD Symbols and Meanings


Entity Relationship Diagram Symbols

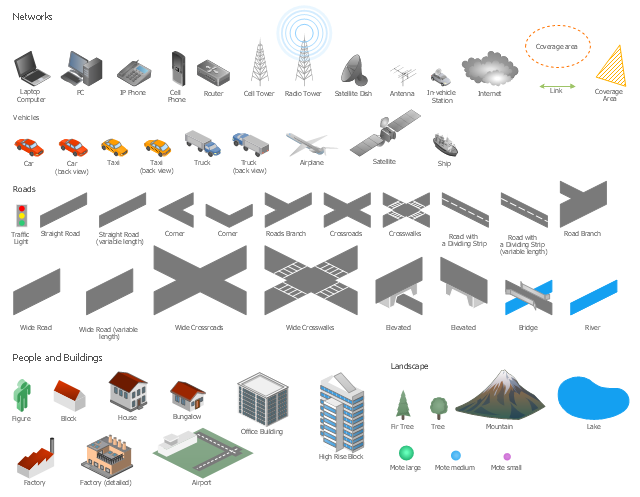
The vector stencils library "Local vehicular networking" contains 88 symbols for drawing the vehicular computer telecommunication network diagrams using the ConceptDraw PRO diagramming and vector drawing software.
"A vehicular ad hoc network (VANET) uses cars as mobile nodes in a MANET to create a mobile network.[1] A VANET turns every participating car into a wireless router or node, allowing cars approximately 100 to 300 metres of each other to connect and, in turn, create a network with a wide range. As cars fall out of the signal range and drop out of the network, other cars can join in, connecting vehicles to one another so that a mobile Internet is created. It is estimated that the first systems that will integrate this technology are police and fire vehicles to communicate with each other for safety purposes. ...
Vehicular ad hocal networks are expected to implement wireless technologies such as dedicated short-range communications (DSRC) which is a type of Wi-Fi. Other candidate wireless technologies are cellular, satellite, and WiMAX. Vehicular ad hoc networks can be viewed as component of the intelligent transportation systems (ITS).
As promoted in ITS, vehicles communicate with each other via inter-vehicle communication (IVC) as well as with roadside base stations via roadside-to-vehicle communication (RVC)." [Vehicular ad hoc network. Wikipedia]
The example "Design elements - Local vehicular networking" is included in the Vehicular Networking solution from the Computer and Networks area of ConceptDraw Solution Park.
Vehicular network diagram symbols
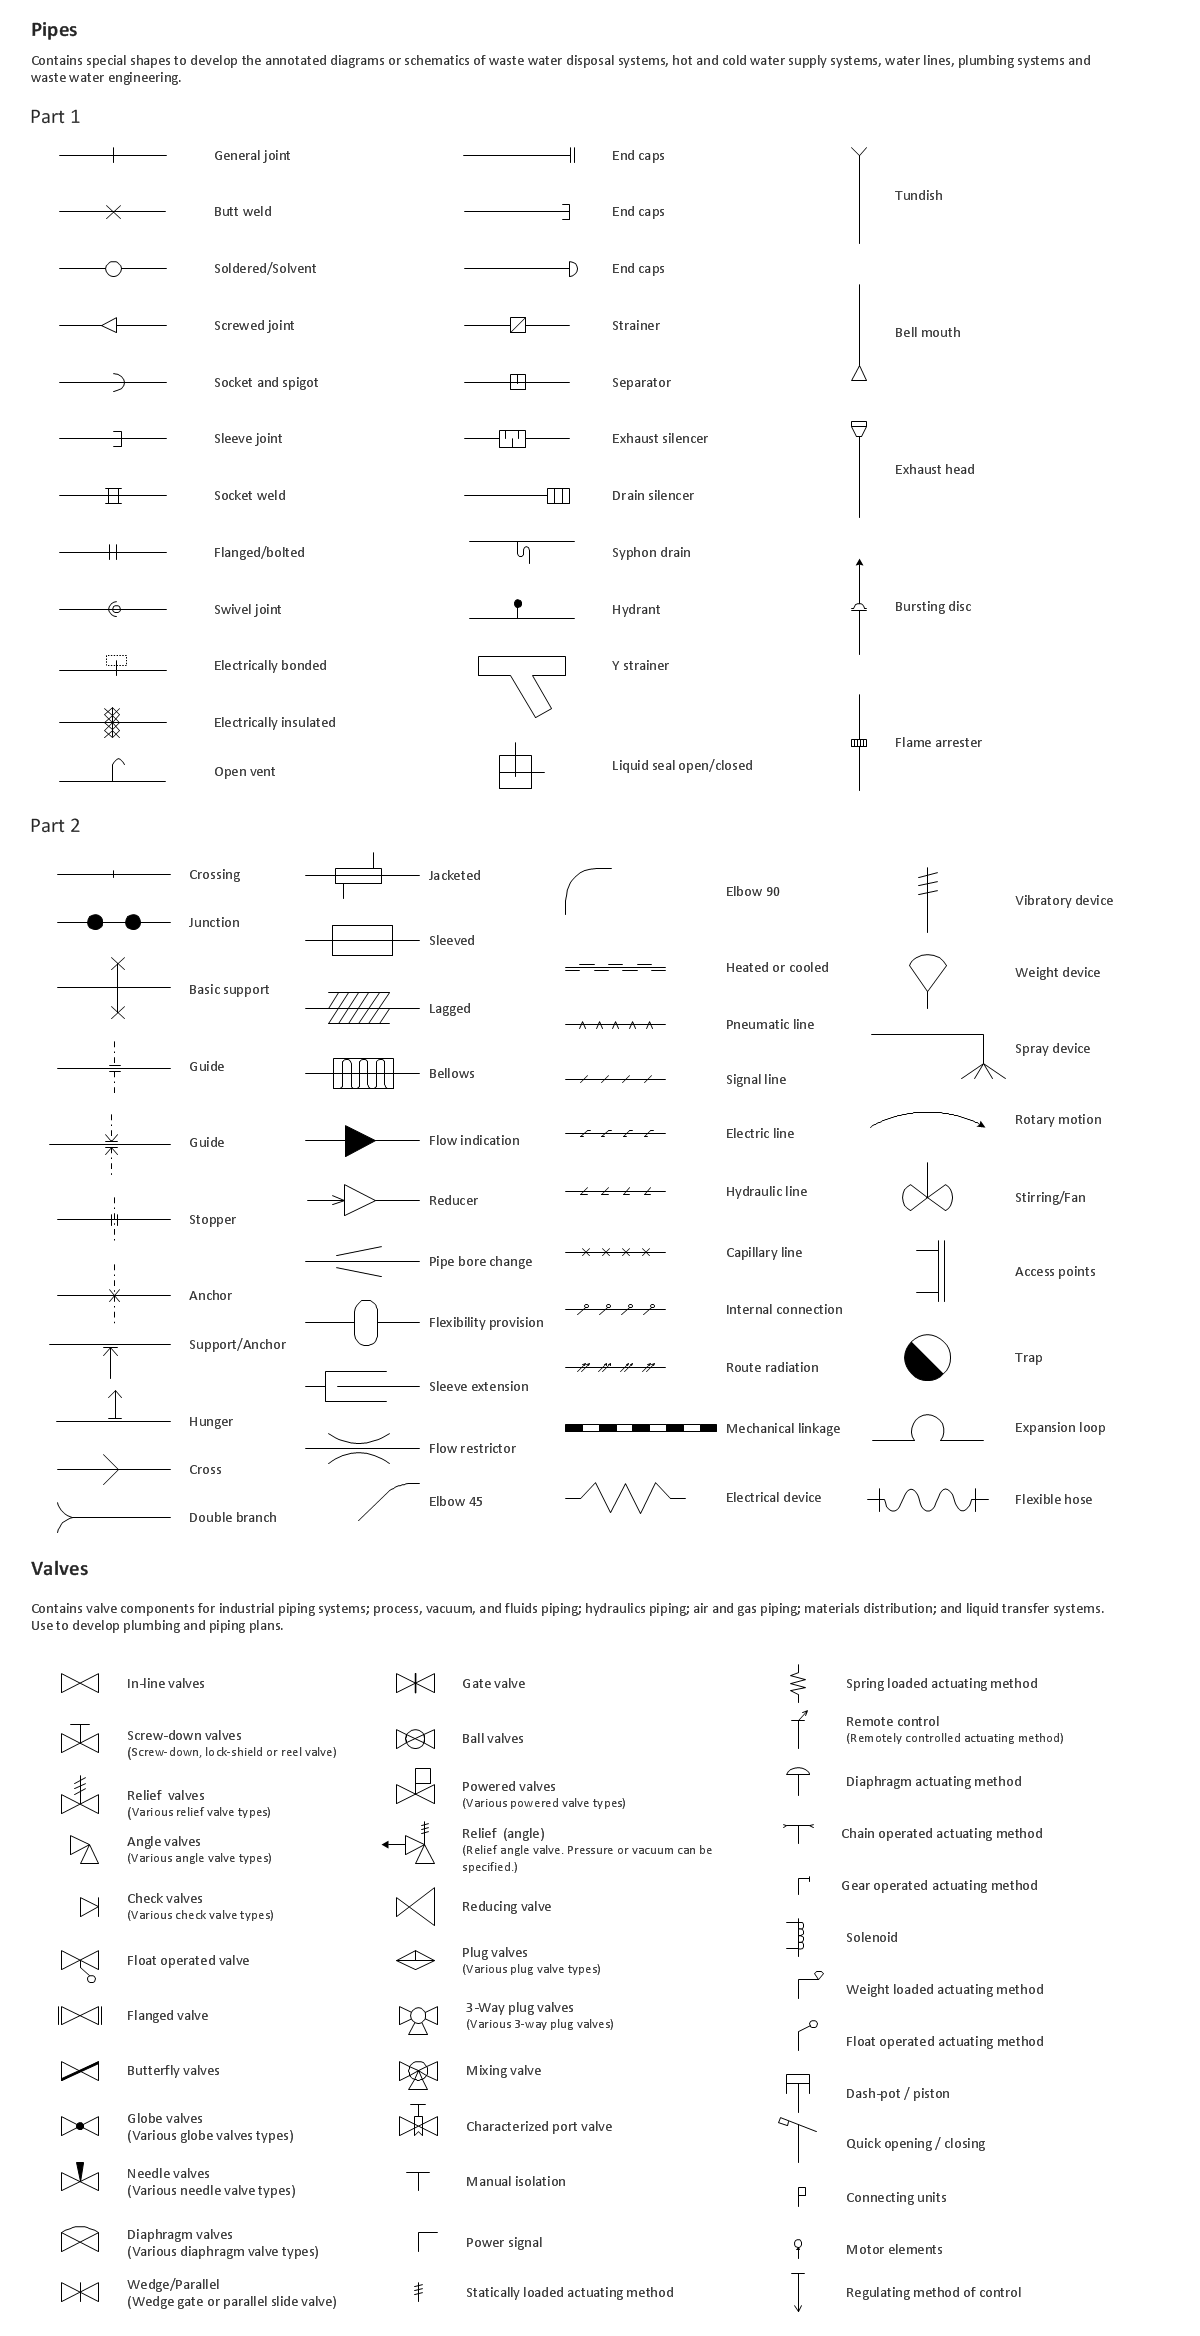
Building Drawing. Design Element: Piping Plan

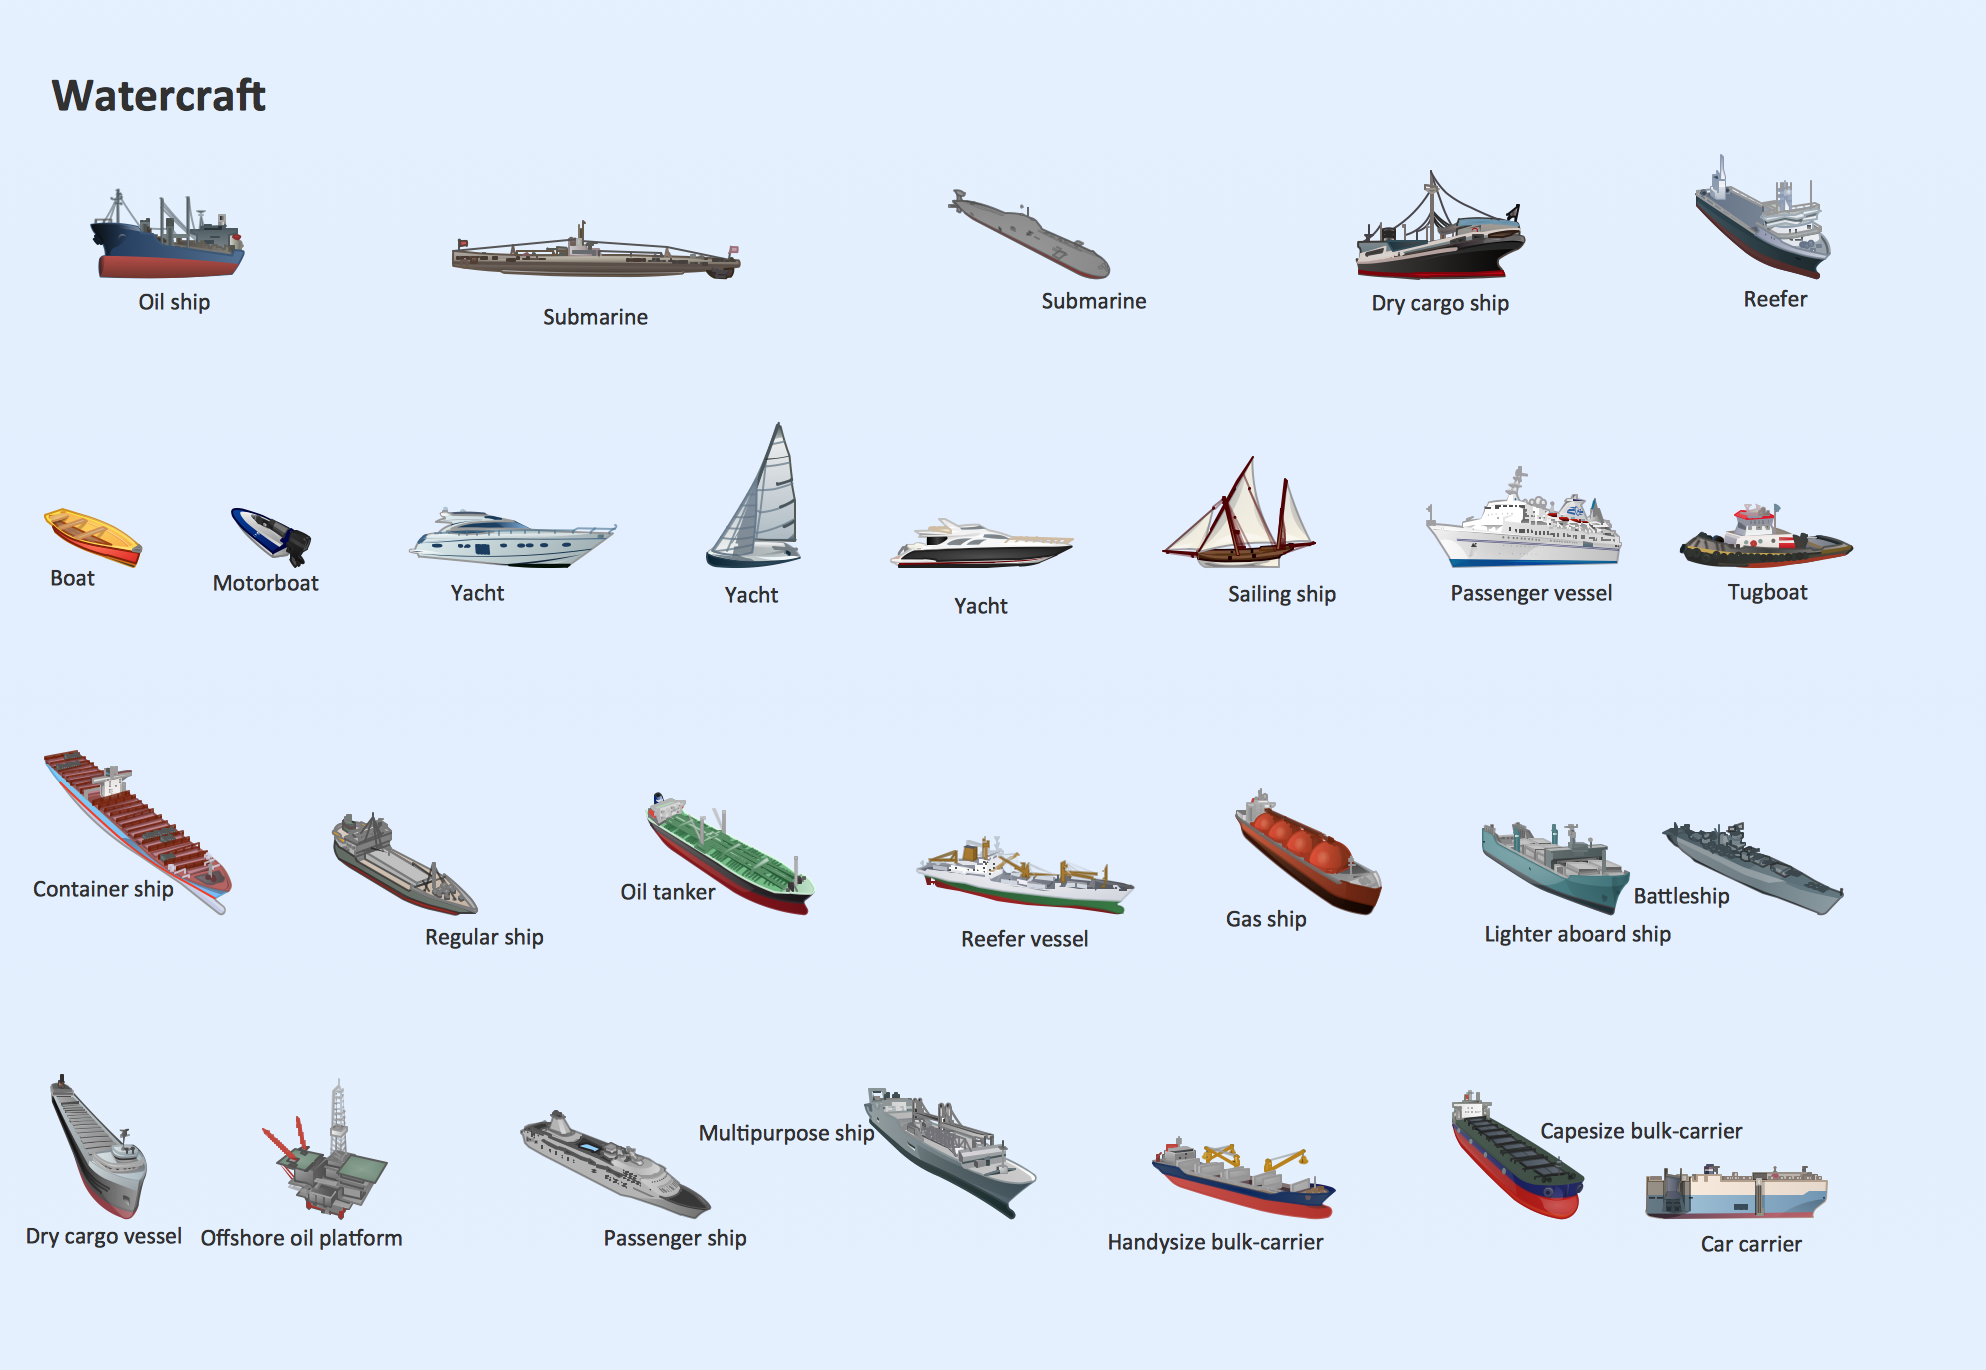
Watercraft - Design Elements
UML Class Diagram Generalization Example UML Diagrams

Relationships Analysis


What is Entity-Relationship Diagram

Entity Relationship Diagram Examples

Flowchart Components

- Ship Building Structural Drawing Symbols
- Engg Drawing Symbols Of Ship
- Ship Structural Drawings Symbols
- Ship Hydraulics Valve Symbols
- Ship Building Structural Drawing
- Structural Drawing For Shipbuilding
- Aerospace and Transport | Watercraft - Design Elements | Ship Oil ...
- Ship Building Process Schematic Diagram
- Shipbuilding Drawing Symbols
- Instrument Cable Layout And Symbol Ship