Mathematics Symbols

HelpDesk
How to Draw Geometric Shapes in ConceptDraw PRO

Mathematical Diagrams

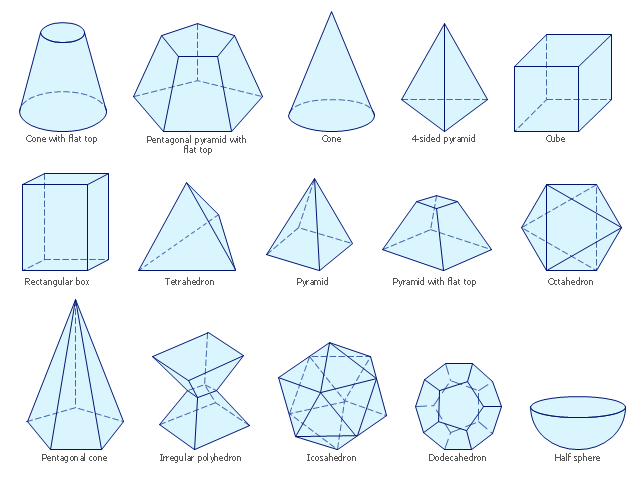
The vector stencils library "Solid geometry" contains 15 shapes of solid geometric figures.
"In mathematics, solid geometry was the traditional name for the geometry of three-dimensional Euclidean space - for practical purposes the kind of space we live in. It was developed following the development of plane geometry. Stereometry deals with the measurements of volumes of various solid figures including cylinder, circular cone, truncated cone, sphere, and prisms.
The Pythagoreans had dealt with the regular solids, but the pyramid, prism, cone and cylinder were not studied until the Platonists. Eudoxus established their measurement, proving the pyramid and cone to have one-third the volume of a prism and cylinder on the same base and of the same height, and was probably the discoverer of a proof that the volume of a sphere is proportional to the cube of its radius." [Solid geometry. Wikipedia]
The shapes example "Design elements - Solid geometry" was created using the ConceptDraw PRO diagramming and vector drawing software extended with the Mathematics solution from the Science and Education area of ConceptDraw Solution Park.
Solid geometrical figures
 Mathematics
Mathematics solution extends ConceptDraw PRO software with templates, samples and libraries of vector stencils for drawing the mathematical illustrations, diagrams and charts.
Physics Symbols

Basic Flowchart Symbols and Meaning


Scientific Symbols Chart

Mathematics Solution from the Science and Education area of ConceptDraw Solution Park includes a few shape libraries of plane, solid geometric figures, trigonometrical functions and greek letters to help you create different professional looking mathematic illustrations for science and education.
Venn Diagrams

Venn Diagram Examples for Problem Solving. Venn Diagram as a Truth Table

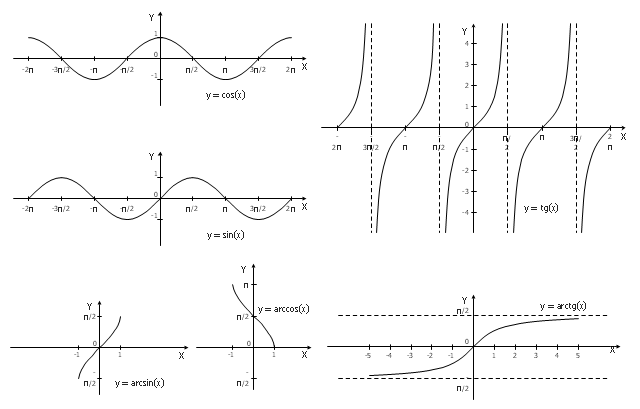
The vector stencils library "Trigonometric functions" contains 8 shapes of trigonometrical and inverse trigonometrical functions graphs.
"In mathematics, the trigonometric functions (also called the circular functions) are functions of an angle. They relate the angles of a triangle to the lengths of its sides. Trigonometric functions are important in the study of triangles and modeling periodic phenomena, among many other applications.
The most familiar trigonometric functions are the sine, cosine, and tangent. In the context of the standard unit circle with radius 1 unit, where a triangle is formed by a ray originating at the origin and making some angle with the x-axis, the sine of the angle gives the length of the y-component (the opposite to the angle or the rise) of the triangle, the cosine gives the length of the x-component (the adjacent of the angle or the run), and the tangent function gives the slope (y-component divided by the x-component). More precise definitions are detailed below. Trigonometric functions are commonly defined as ratios of two sides of a right triangle containing the angle, and can equivalently be defined as the lengths of various line segments from a unit circle. More modern definitions express them as infinite series or as solutions of certain differential equations, allowing their extension to arbitrary positive and negative values and even to complex numbers." [Trigonometric functions. Wikipedia]
The shapes example "Design elements - Trigonometric functions" was created using the ConceptDraw PRO diagramming and vector drawing software extended with the Mathematics solution from the Science and Education area of ConceptDraw Solution Park.
Trigonometrical and inverse trigonometrical functions - Graphs
Basic Diagramming


How to Create a Pie Chart

How to Create a Pyramid Diagram

- Plane Shapes In Mathematics Pdf
- Mathematical Shapes Symbols And Figure
- Using Mathematical Shapes Symbols And Figures
- Mathematics | Cisco Network Topology. Cisco icons, shapes ...
- Mathematical Shapes Pdf
- Mathematics Symbols | How to Draw Geometric Shapes in ...
- Mathematical Shapes Symbols And Figures
- Mathematical Diagrams | Mathematics Symbols | Physics Symbols ...
- Mathematics Symbols | Scientific Symbols Chart | How to Draw ...
- Mathematics Symbols | Scientific Symbols Chart | Mathematics ...
- How to Draw Geometric Shapes in ConceptDraw PRO ...
- Diagrams Of Plane Shapes In Maths
- Sun Solar System | Education Solution. ConceptDraw.com | Sun ...
- Mathematics Symbols | Design elements - Solid geometry | Design ...
- Diagrams Of Mathematical Shapes
- Diagram Of Flat And Solid Shapes In Mathematics
- How to Draw Geometric Shapes in ConceptDraw PRO ...
- Basic Diagramming | Mathematics | How to Draw Geometric Shapes ...
- Mathematical Diagrams | Mathematics Symbols | Basic Flowchart ...
- Draw The Diagrams Of Mathematics Different Shapes