This site uses cookies. By continuing to browse the ConceptDraw site you are agreeing to our Use of Site Cookies.

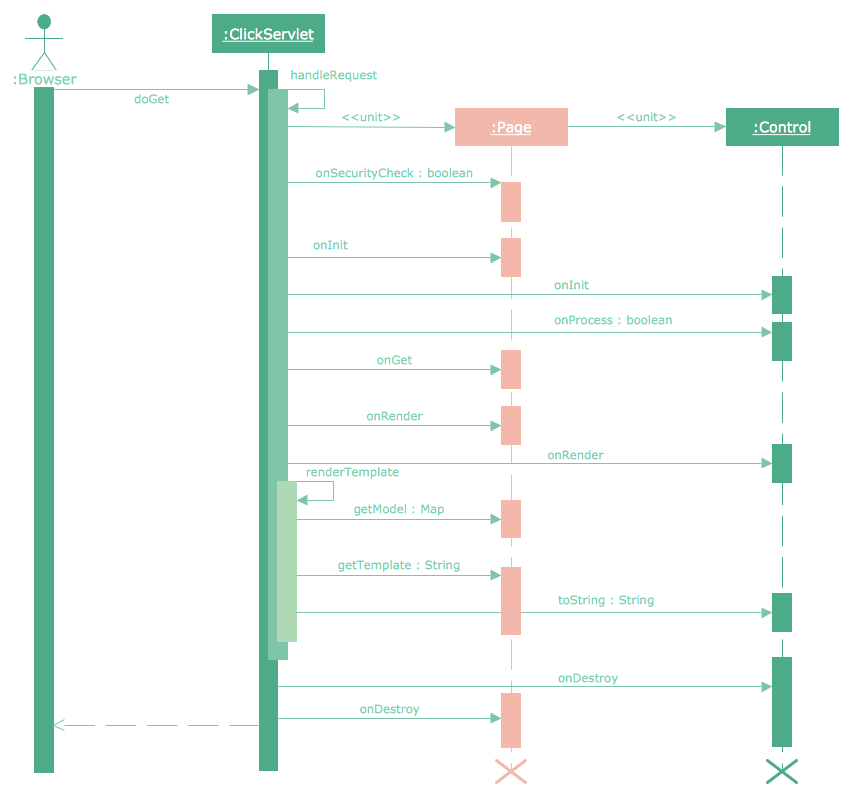
Sequence Diagram Tool

ConceptDraw DIAGRAM diagramming and vector drawing software as a sequence diagram tool provides the Rapid UML Solution from the Software Development Area that contains the UML Sequence library.

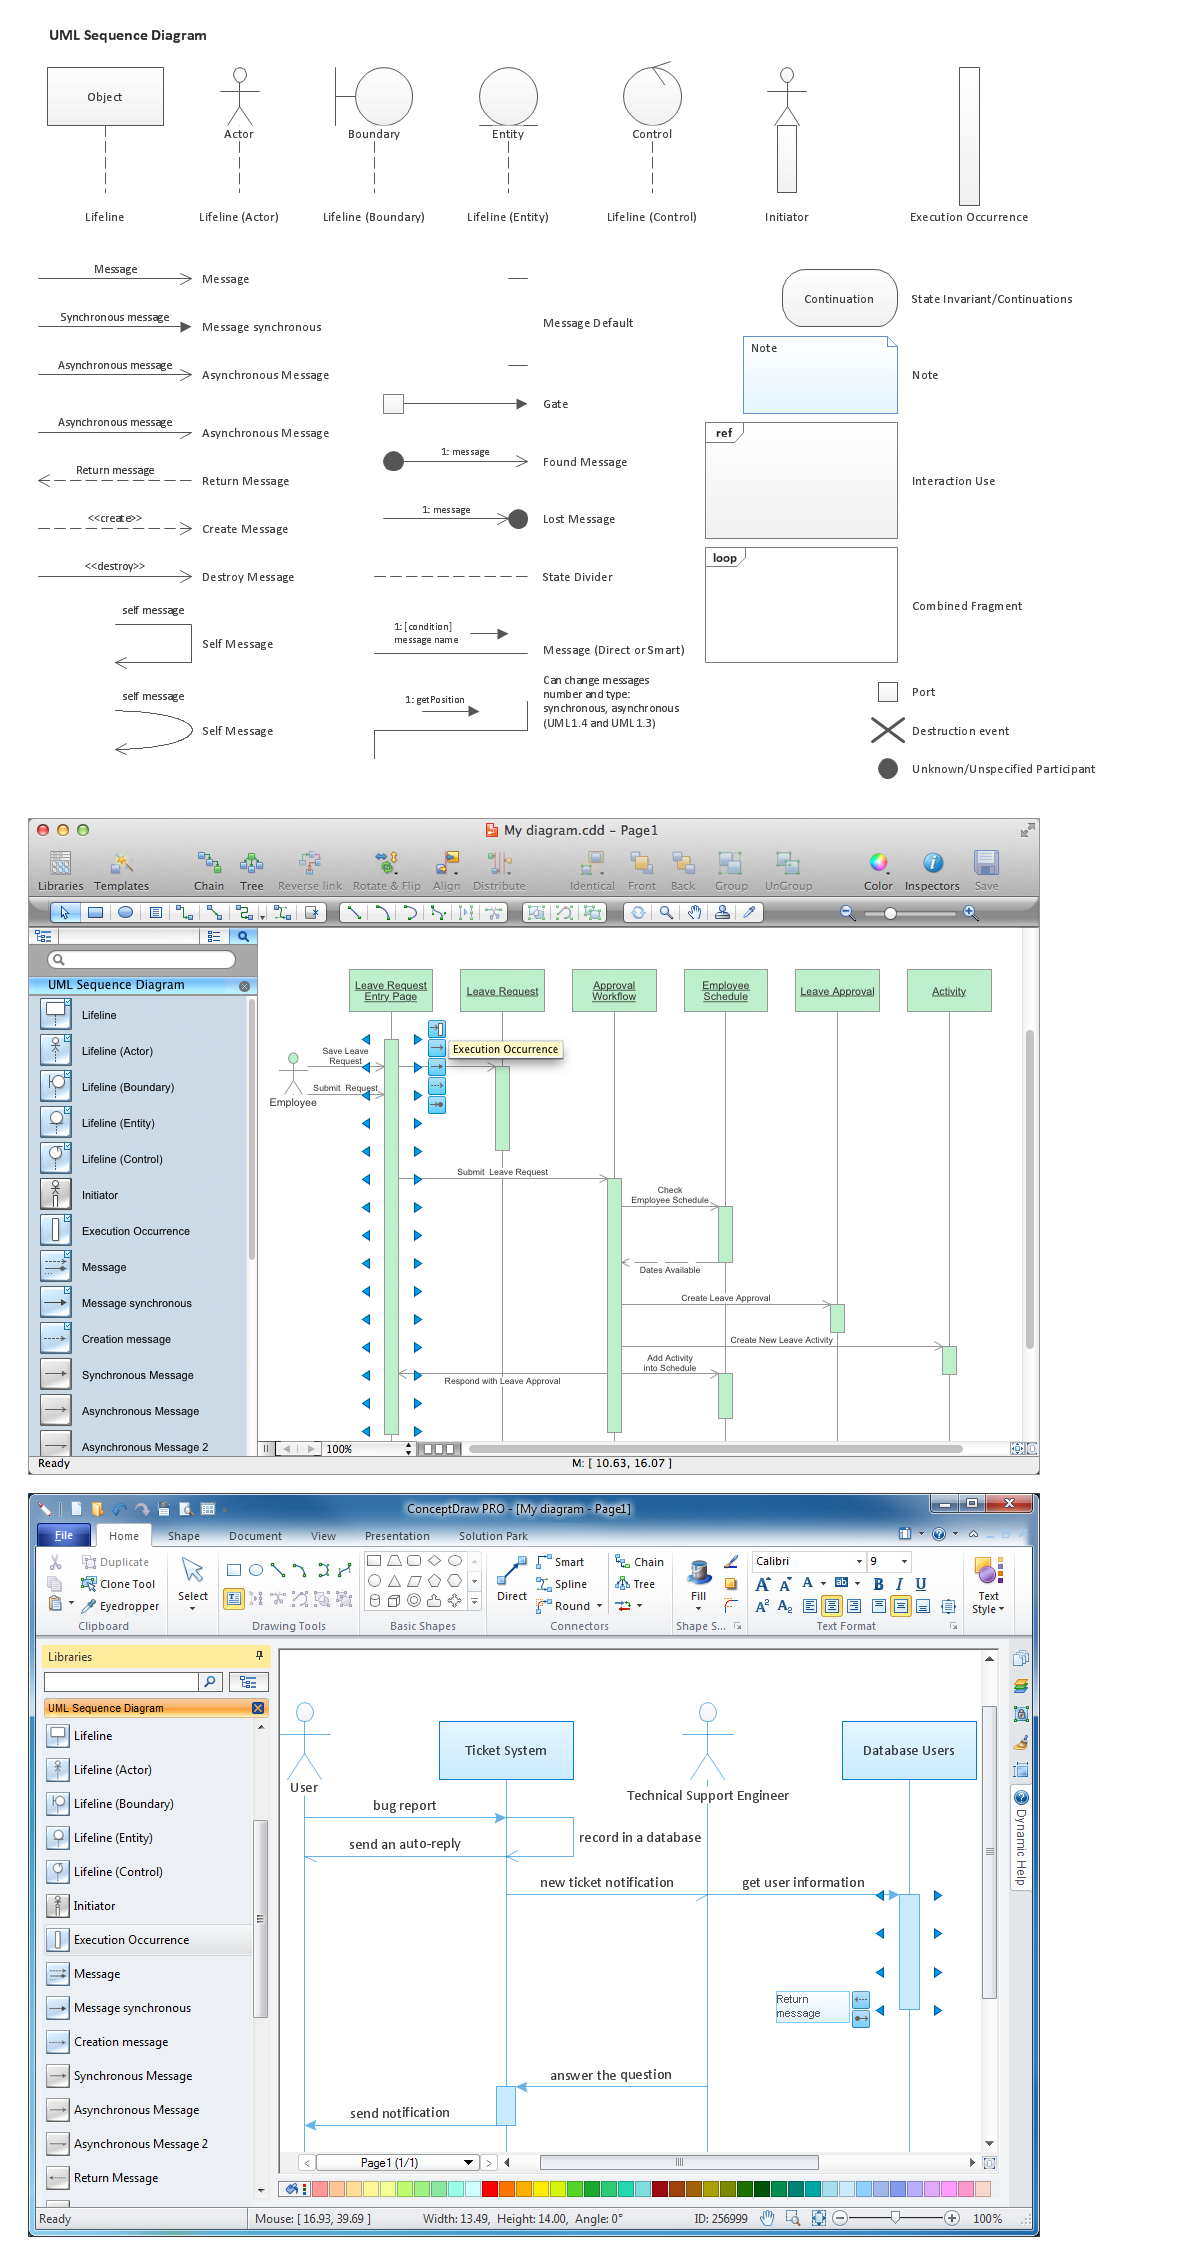
UML Tool & UML Diagram Examples
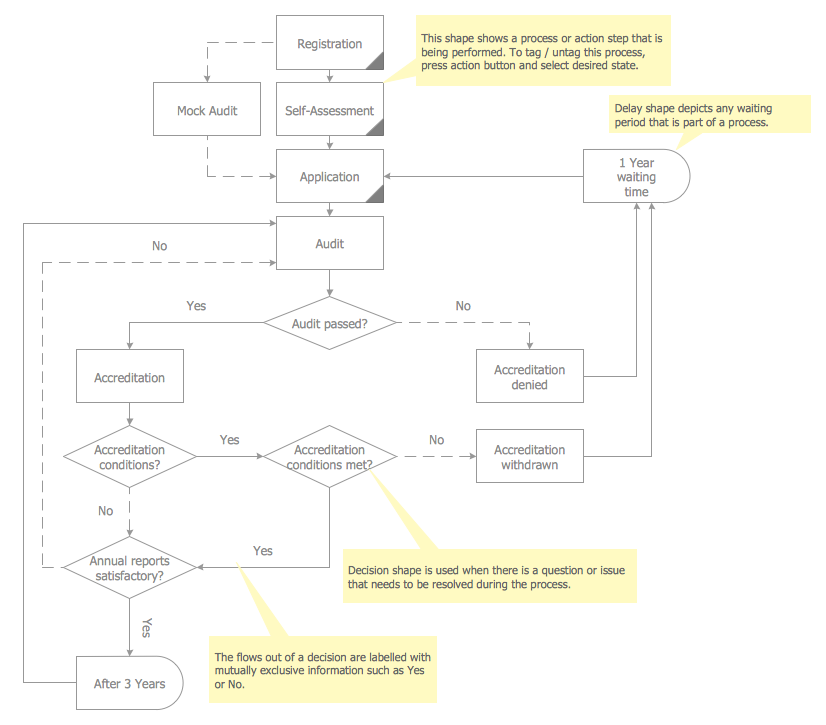
The Unified Modeling Language (abbr. UML) is a general-purpose modeling language widely used in the field of software development, software engineering, education, science, industry, business. In 1997 the UML was approved as a standard by the OMG (Object Management Group) and in 2005 was published as ISO standard by the International Organization for Standardization. UML is widely and succesfully applied for optimization the process of software systems development and business systems analysis. There are used 14 types of UML diagrams, 7 from them depict structural information, another 7 types represent different types of behavior and aspects of interactions. Design of any automated process is easy with ConceptDraw DIAGRAM and unique Rapid UML solution from the Software Development area, which provides numerous UML examples, templates and vector stencils libraries for drawing all types of UML 1.x and UML 2.x diagrams. Use of predesigned UML diagram examples and templates lets you quickly start drawing your own UML diagrams in ConceptDraw DIAGRAM software.

Audit Steps

Audit Steps - The auditing process is an independent examination of data, statements, operations, records, financial or otherwise performances of an enterprise for any stated purpose. It is a complex process that includes 10 audit steps: Notification, Planning, Opening Meeting, Fieldwork, Communication, Draft Audit, Management Response, Final Meeting, Report Distribution, Feedback.

Diagramming Software for designing UML Sequence Diagrams

Sequence Diagrams shows how objects communicate with each other in terms of a sequence of messages. Also indicates the lifespans of objects relative to those messages.

Data Flow Diagram

Data Flow Diagram (DFD) is the part of the Structured Systems Analysis and Design Methodology (SSADM), which is intended for information systems projection and analysis. Data Flow Diagrams allow graphically represent the data flows in information system and analyze the data processing during the structural projection. This type of diagrams lets visually show a work of information system and results of this work, it is often used in connection with human processes and can be displayed as Workflow diagram. Data Flow Diagram visualizes processes and functions, external entities, data depositories, and data flows connecting these elements and indicating direction and data character. Each of these elements used for DFD has its own graphical notation. There are two notations to draw DFDs - Yourdon & Coad and Gane & Sarson. ConceptDraw DIAGRAM extended with Data Flow Diagrams (DFD) solution from Software Developmant area is ideal for designing professional looking DFDs, which can be then easily exported in various formats.

Context Diagram Template

This template shows the Context Diagram. It was created in ConceptDraw DIAGRAM diagramming and vector drawing software using the Block Diagrams Solution from the “Diagrams” area of ConceptDraw Solution Park. The context diagram graphically identifies the system. external factors, and relations between them. It’s a high level view of the system. The context diagrams are widely used in software engineering and systems engineering for designing the systems that process the information.

Flowchart on Bank. Flowchart Examples
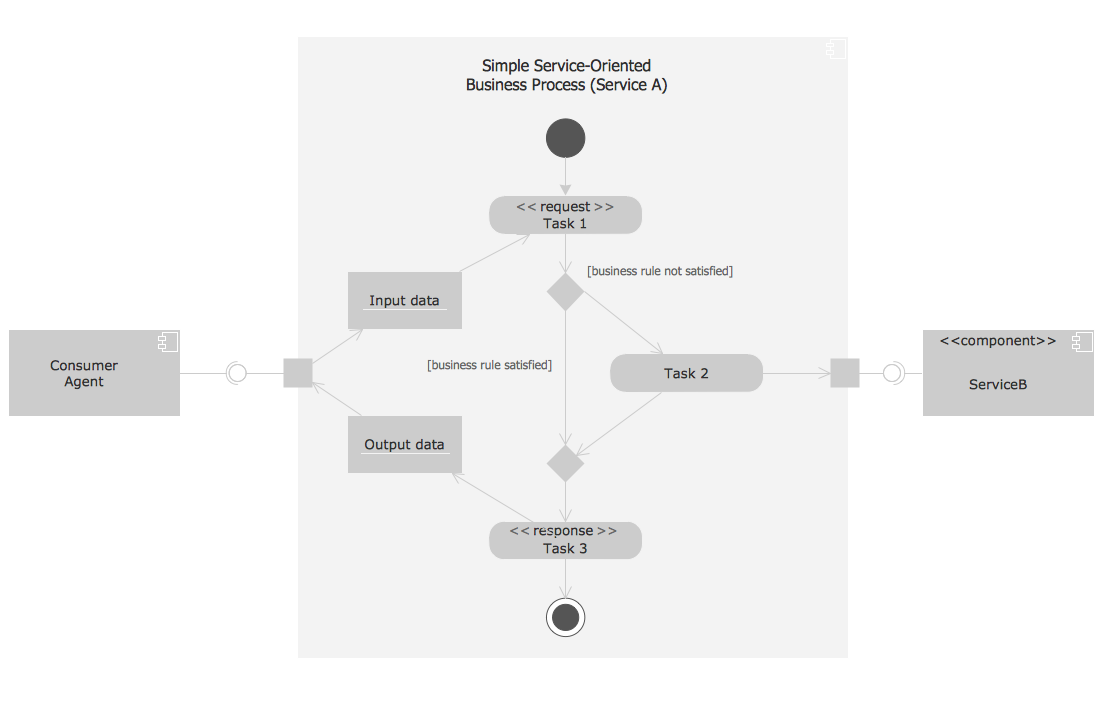
This sample was created in ConceptDraw DIAGRAM diagramming and vector drawing software using the Flowcharts solution from the Diagrams area of ConceptDraw Solution Park. This sample shows the Flowchart of the Subprime Mortgage Crisis. This Flowchart describes the decline in housing prices when the housing bubble burst and what it caused on the housing and financial markets. You can also see the Government and Industry responses in this crisis situation.
Create Flowchart on Bank

Process with UML

This UML activity diagram shows the abstract example of orchestration of service-oriented business process. Orchestration is the method for composition the hierarchical and self-contained service-oriented business processes. It is coordinated by the single agent. This sample was created in ConceptDraw DIAGRAM diagramming and vector drawing software using the Rapid UML Solution from the Software Development area of ConceptDraw Solution Park.

Presenting Documents with Skype

Presentation tools. A convenient tool to present documents via Skype. Share your desktop, collaborate on documents in real-time and run a web conference one-on-one or one-to-many. A tool for sharing and presenting business documents via Skype. Allows to present Microsoft® Word®, Microsoft PowerPoint®, Microsoft Project® and plenty mindmapping formats.

Fishbone Software Tools for Design Element

Cause and Effect diagram (Ishikawa diagram or Fishbone diagram) software helps you to show in one diagram the factors of Equipment, People, Process, Environment, Management and Materials, which all in general affect the overall problem and gives the base for the further analysis. ConceptDraw DIAGRAM is perfect software for designers and software developers who need to create Fishbone diagrams. You will get a simple problem-analysis tool - Fishbone software tools for design element to easy construct specific diagrams and identify many possible causes for an effect to attack complex problem solving.