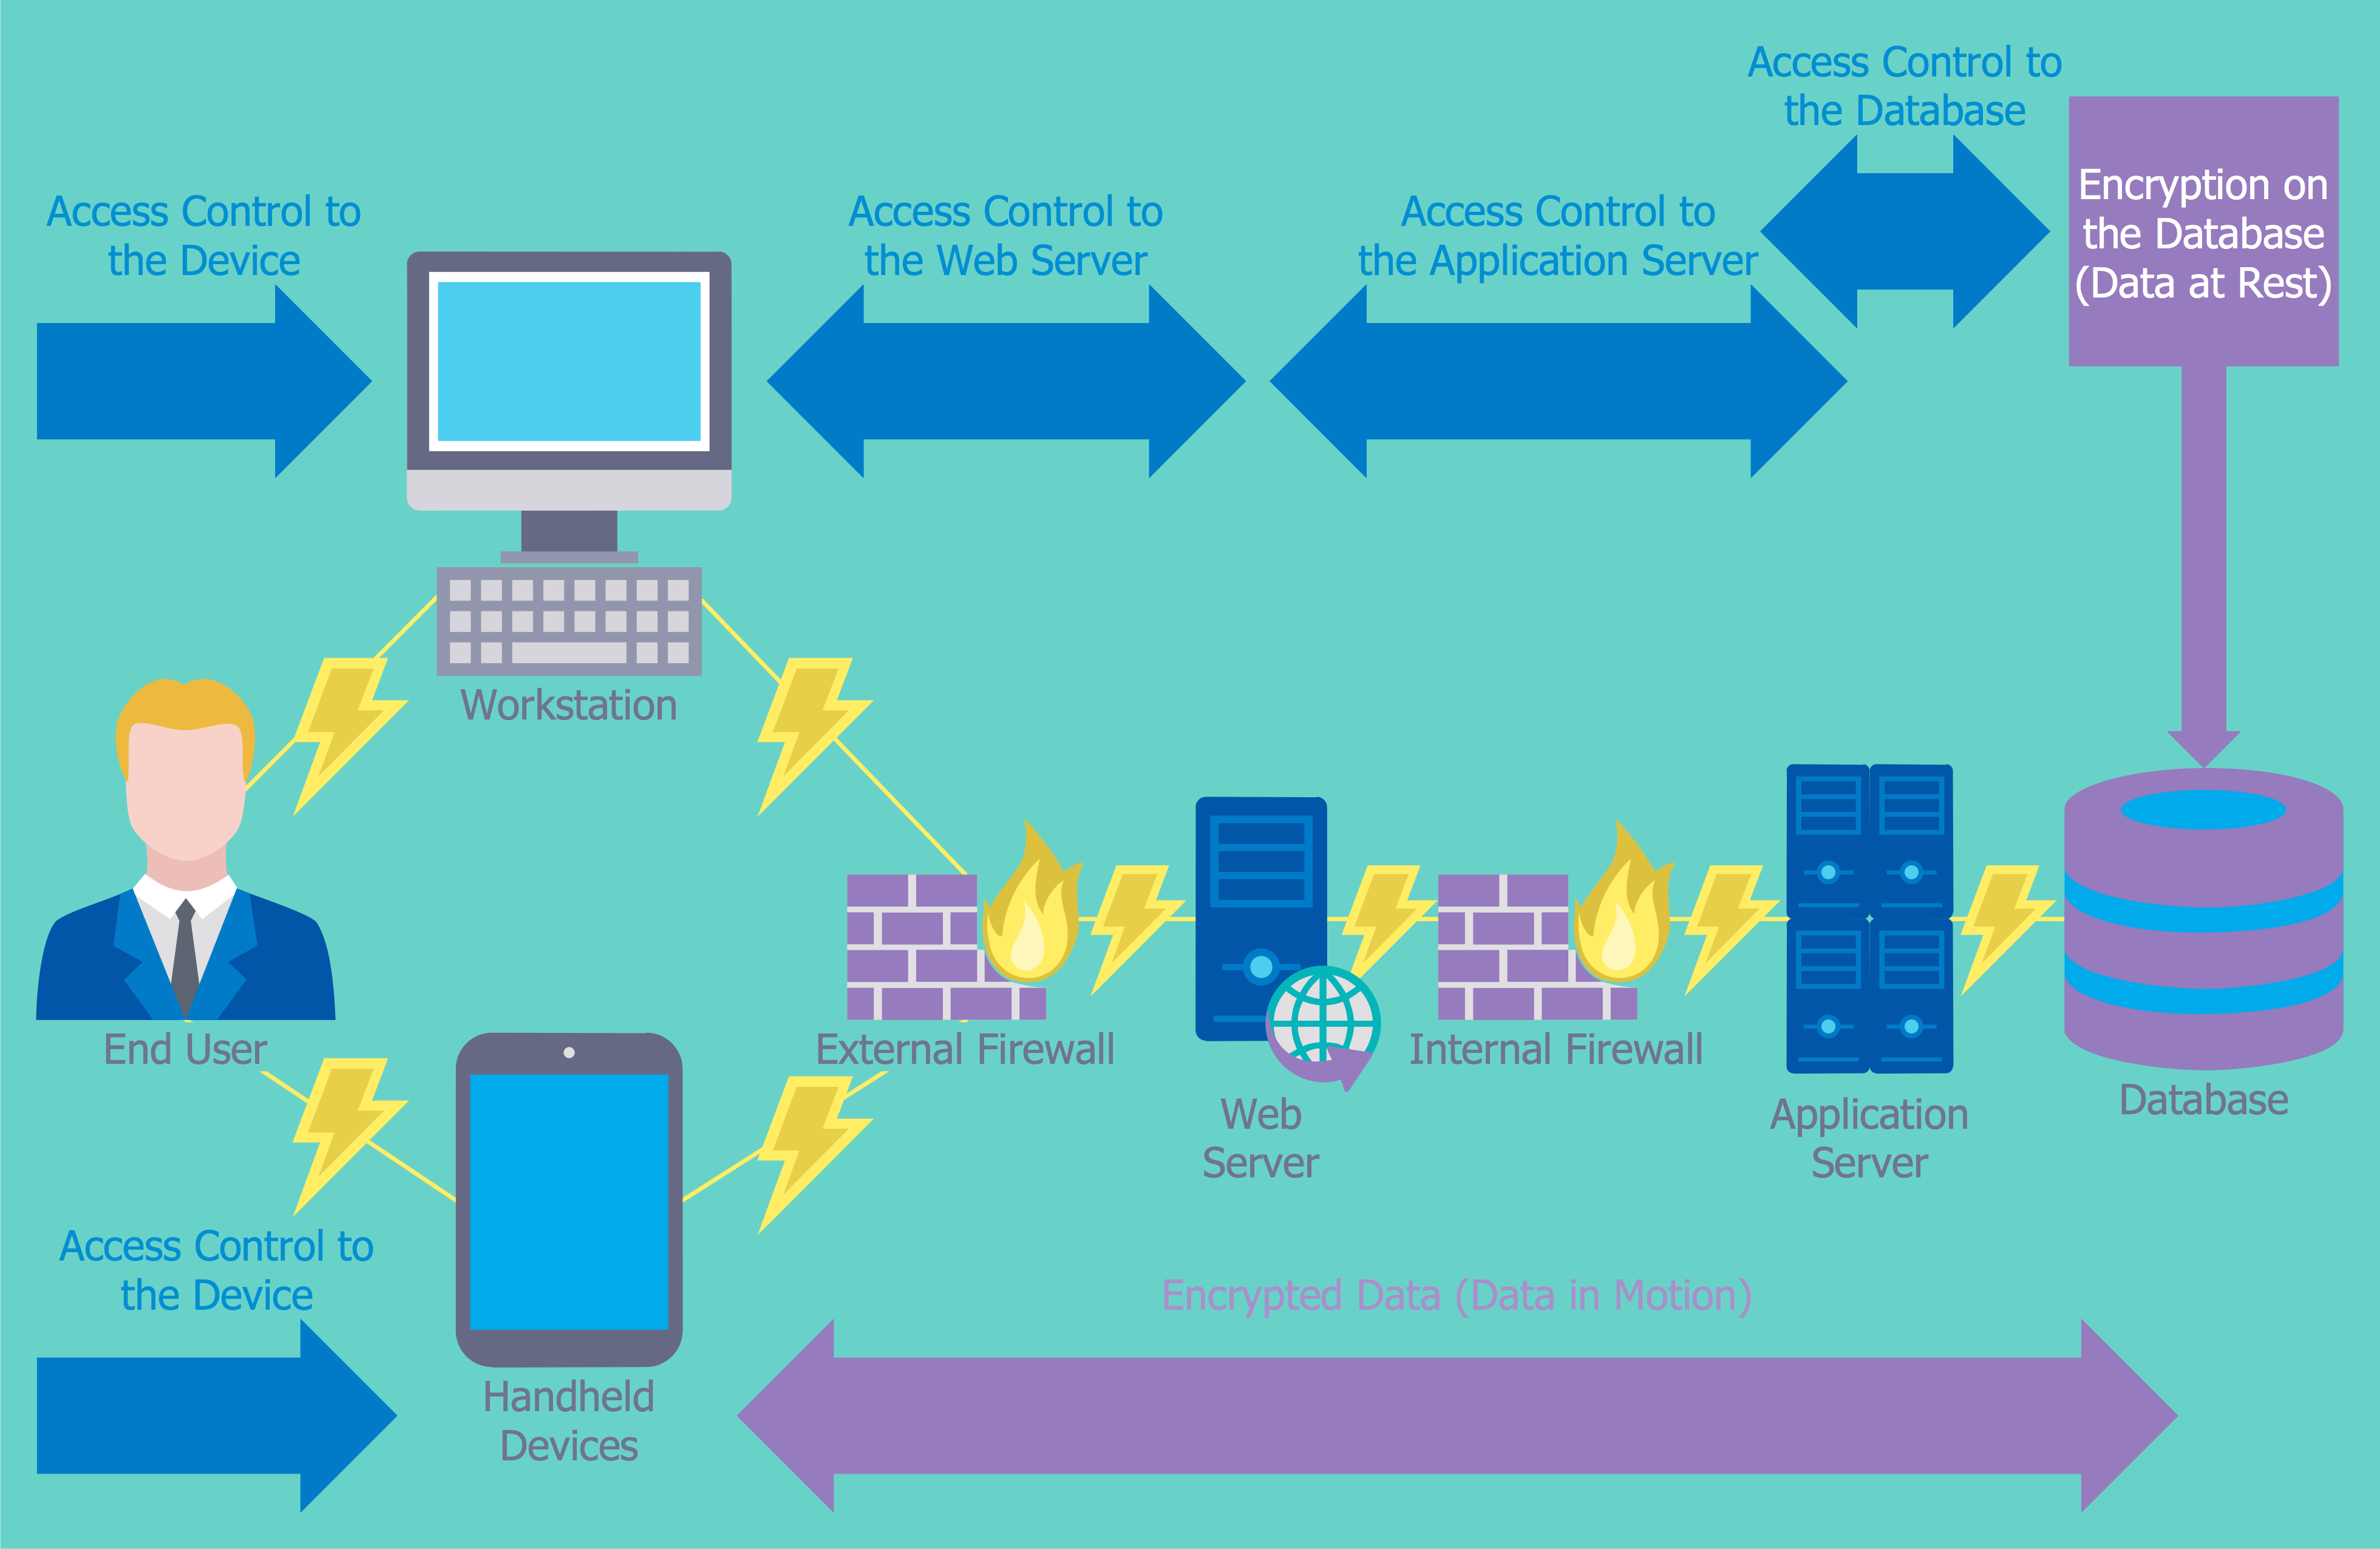
Security Plans
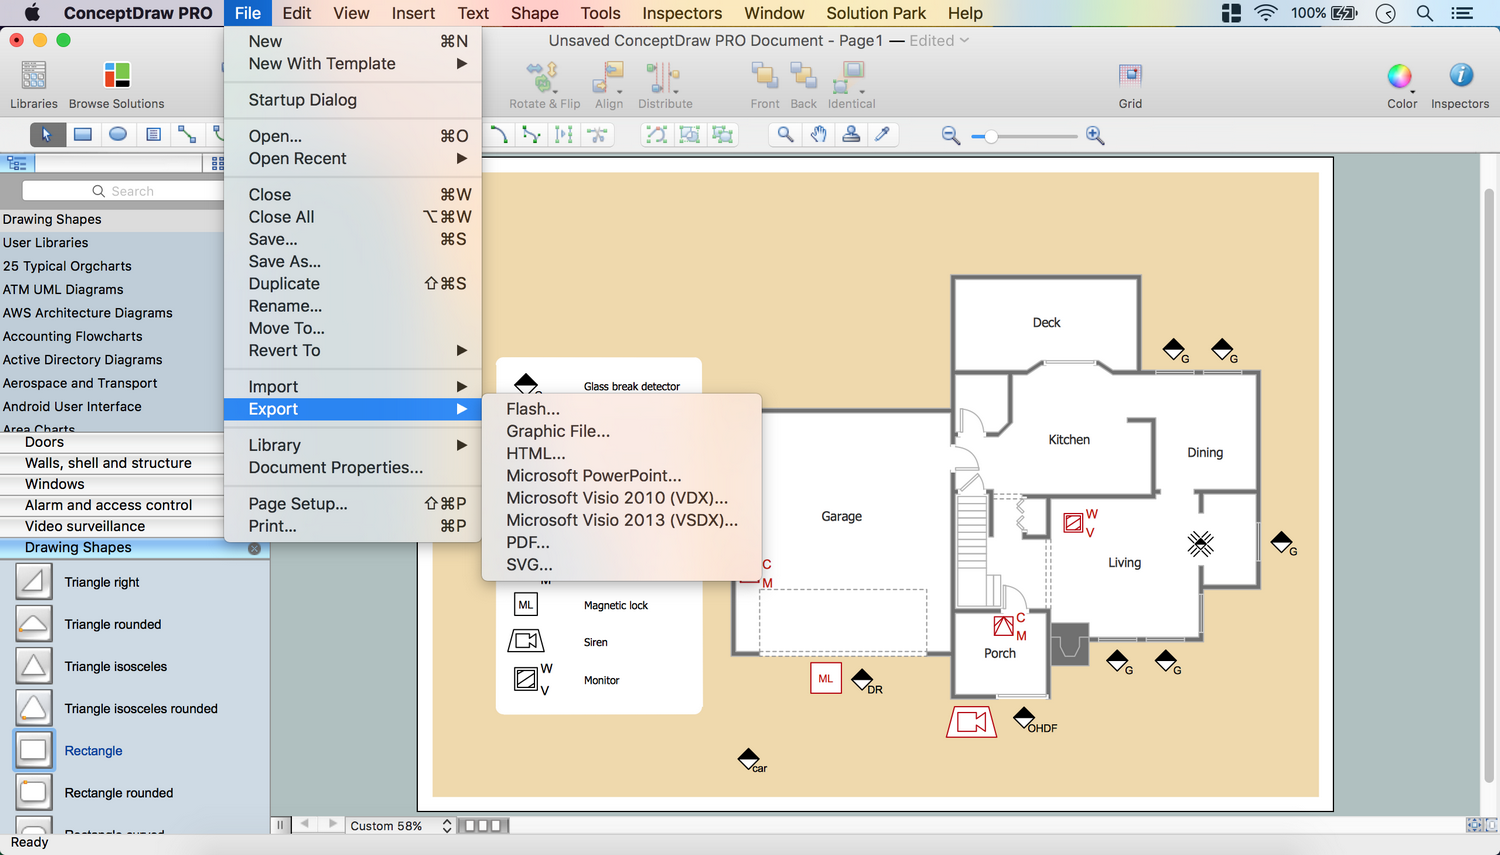
Network Security Devices
This flow chart sample was drawn on the base on the illustration of the article "Climate change impact on China food security in 2050" from the website of Chinese Academy of Agricultural Sciences .
[caas.cn/ en/ newsroom/ research_ update/ 67347.shtml]
"Food security is a condition related to the ongoing availability of food. ...
According to the Food and Agriculture Organization (FAO), food security "exists when all people, at all times, have physical and economic access to sufficient, safe and nutritious food to meet their dietary needs and food preferences for an active and healthy life". ...
Extreme events, such as droughts and floods, are forecast to increase as climate change takes hold. Ranging from overnight floods to gradually worsening droughts, these will have a range of impacts on the agricultural sector. ...
According to the Climate & Development Knowledge Network report Managing Climate Extremes and Disasters in the Agriculture Sectors: Lessons from the IPCC SREX Report, the impacts will include changing productivity and livelihood patterns, economic losses, and impacts on infrastructure, markets and food security. Food security in future will be linked to our ability to adapt agricultural systems to extreme events." [Food security. Wikipedia]
The flowchart example "Food security assessment" was created using the ConceptDraw PRO diagramming and vector drawing software extended with the Flowcharts solution from the area "What is a Diagram" of ConceptDraw Solution Park.
Flowchart

UML Flowchart Symbols

Flowchart design. Flowchart symbols, shapes, stencils and icons


Technical Flow Chart Example

Cloud Computing Architecture Diagrams

 HR Flowcharts
Human resource management diagrams show recruitment models, the hiring process and human resource development of human resources.
Column Chart Template

- Sample Flow Diagram On Security Process
- Flow Chart Diagram Of A Burglar Alarm System
- Process Flowchart | Security and Access Plans | Telecommunication ...
- Flow Chart Of Computer Security
- Process Flowchart | Food security assessment - Flowchart ...
- Food security assessment - Flowchart | Example of DFD for Online ...
- Competitor Analysis | Food security assessment - Flowchart ...
- Food security assessment - Flowchart | Flowcharts | Contoh ...
- Contoh Flowchart | Flowcharts | Security and Access Plans ...
- Process Flow Chart Software Free | Process Flowchart | Cisco ...