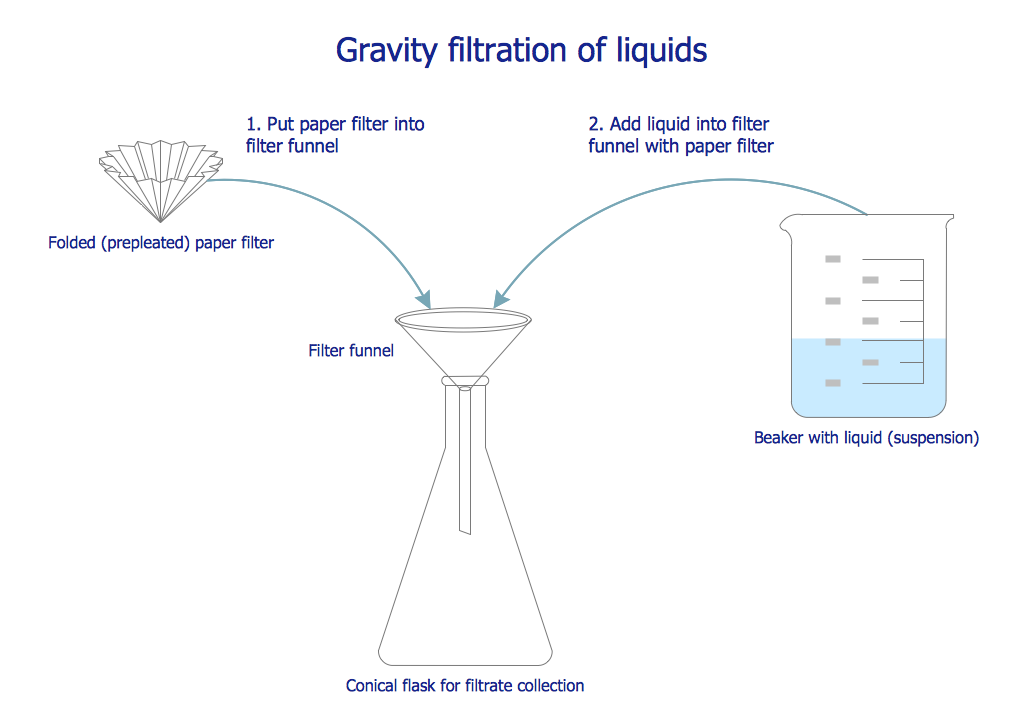
Chemistry Drawings

Data Flow Diagram

Chemistry Symbols and Meanings

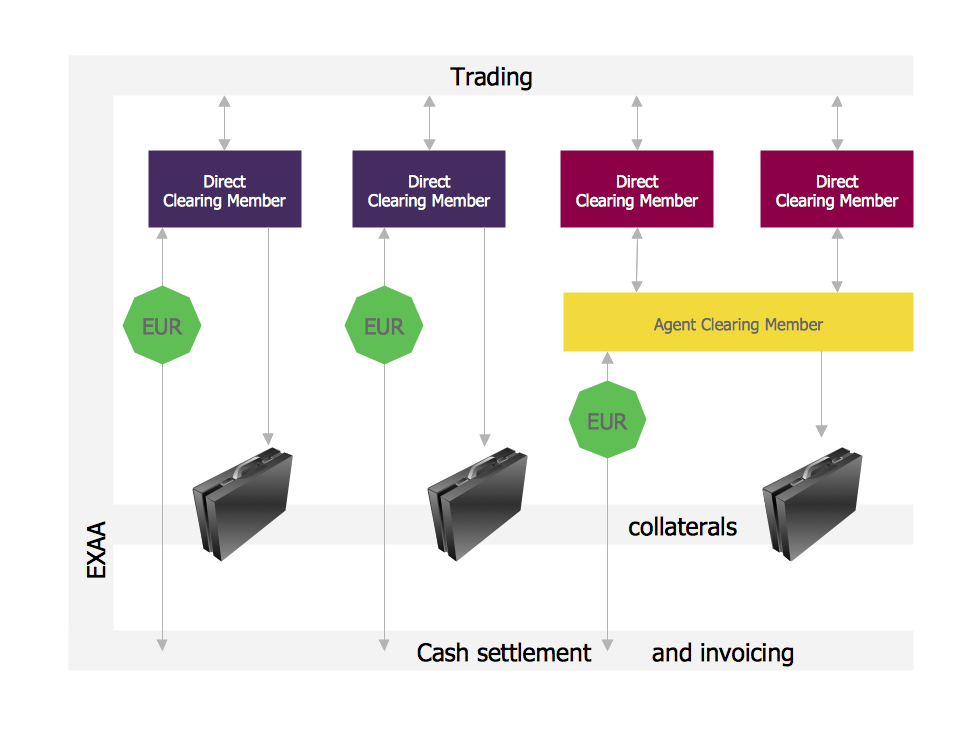
Settlement Process Flowchart. Flowchart Examples
Organic Chemistry Symbols

Data Modeling with Entity Relationship Diagram

Entity Relationship Diagram Examples


Process Flowchart Symbols

The vector stencils library "Education pictograms" contains 128 education pictograms. Use this flat icon set to design your educational infogram in ConceptDraw PRO diagramming and vector drawing software.
The vector stencils library "Education pictograms" is included in the Education Infographics solution from the Business Infographics area of ConceptDraw Solution Park.
The vector stencils library "Education pictograms" is included in the Education Infographics solution from the Business Infographics area of ConceptDraw Solution Park.
ABC

Apple
Artist oil colors

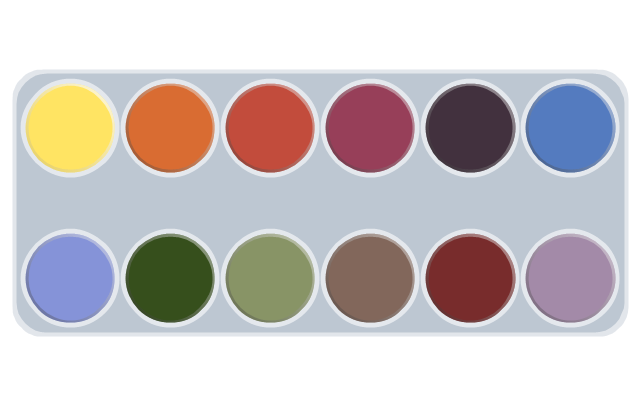
Artists paint palette
Atom

Baseball
Basketball

Beaker

Bell

Bicycle

Book - open

Books

Brushes
Bunsen burner

Calculator
Calendar

CD

Cell model

Chemical flask

Cloud

Colored paper
Colored pencils
Compass

Compasses

Dinosaur skeleton

Diploma

DNA double helix

Drop

Dumbbells

Earth

Earth's internal structure

Easel
Email

Eraser

Exercise book

Felt tip pens
Folders

Football

Funnel

Gears

Globe

Gouache

Graduation cap

Grand piano

Grand piano - clipart
Green blackboard

Hourglass

Laptop

Laptop mouse

Light bulb

Magnet

Magnifier

Marker - black

Marker - blue

Marker - green

Marker - red

Marker - white

Marker - yellow

Medal with ribbon

Metronome

Microscope

Moon

Music notes
Notebook

Notepad

Paper clips

Paper sheet

Paper sheet - grid

Paper sheet - lined

Paper stickers

Parthenon

Pen

Pen - fountain

Pencil

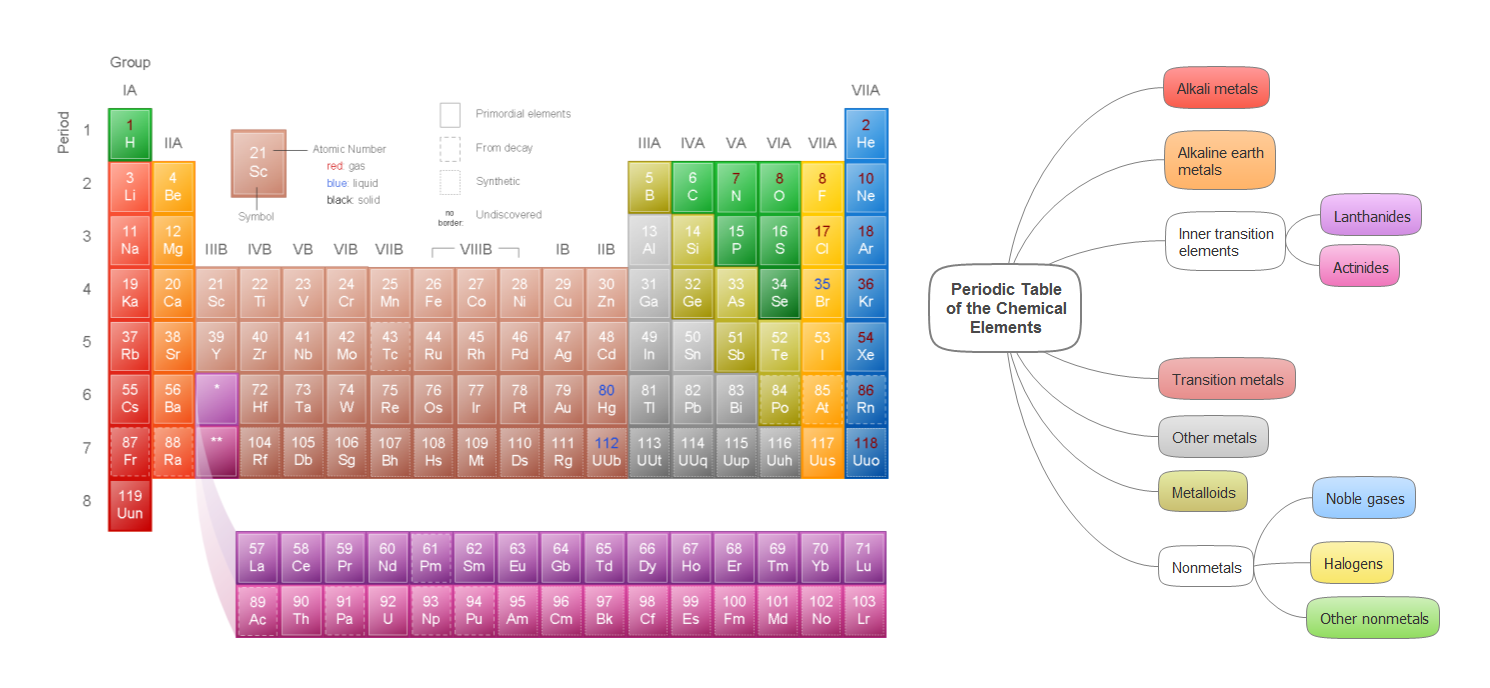
Periodic table
Protractor
Push pins

Robot

Round bottom flask

Rugby ball

Ruler
Scales
School backpack

School bus

School satchel

Schoolboy - african

Schoolboy - asian

Schoolboy - caucasian

Schoolboy - indian

Schoolgirl - african

Schoolgirl - asian

Schoolgirl - caucasian

Schoolgirl - indian

Scissors and a bottle of glue

Scroll

Snowflake

Sport cup

Star

Stickers
Stopwatch

Sun

Tablet computer

Teacher with a pointer

Teacher - african

Teacher - asian

Teacher - caucasian

Teacher - indian

Teacher - woman, african

Teacher - woman, asian

Teacher - woman, caucasian

Teacher - woman, indian

Telescope

Test tube

Thermometer

To-Do list

Tree leaf - acacia

Tree leaf - birch

Tree leaf - chestnut

Tree leaf - maple

Tree leaf - oak

Tree leaf - walnut

Triangle ruler
Volleyball

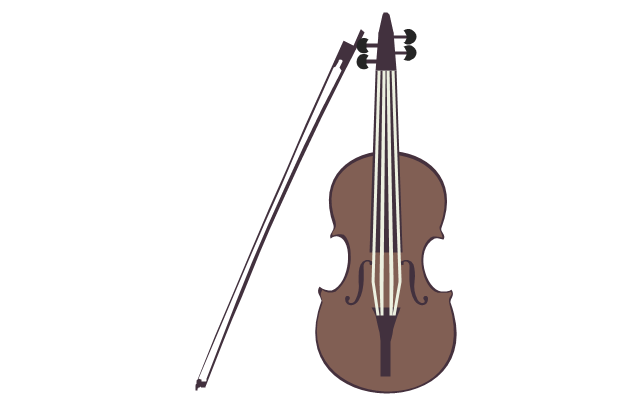
Violin
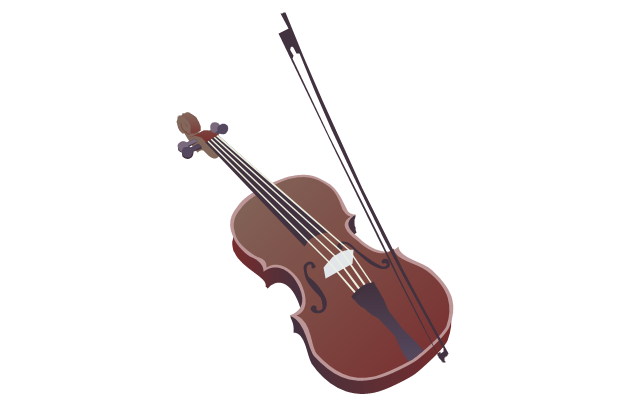
Violin - clipart
Wall clock

Watercolor set
World map

- Block Diagram Of Periodic Table
- Diagram Of The Periodic Table
- Website Wireframe | Block Diagram Of Modern Periodic Table
- Draw A Well Label Diagram Of Periodic Table
- A Schemetatic Diagram Of Modern Periodic Table
- Diagram Of The Blocks Of Element In The Periodic Table
- Well Labelled Diagram Of D Periodic Table And The Block
- Chemistry | Mendelif Block Diagram
- The Periodic Table Clear Diagram
- Diagram Of A Labeled Periodic Table