Sales Growth. Bar Graphs Example

Bar Chart Template for Word

Bar Chart Examples

Waterfall Bar Chart

Bar Diagrams for Problem Solving. Create business management bar charts with Bar Graphs Solution

Bar Chart Software

Bar Diagrams for Problem Solving. Create event management bar charts with Bar Graphs Solution

Column Chart Examples

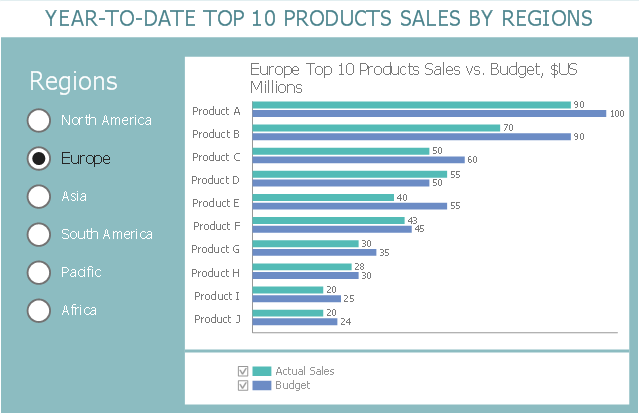
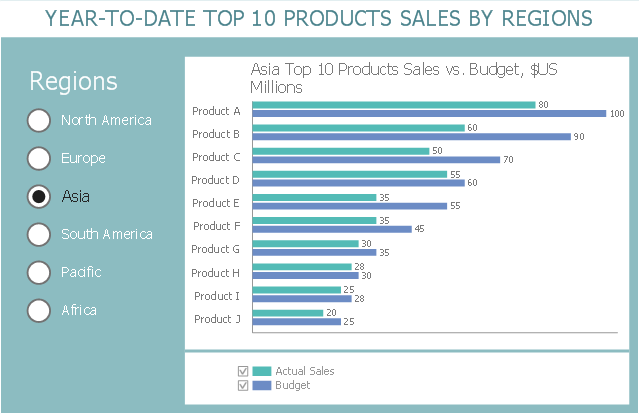
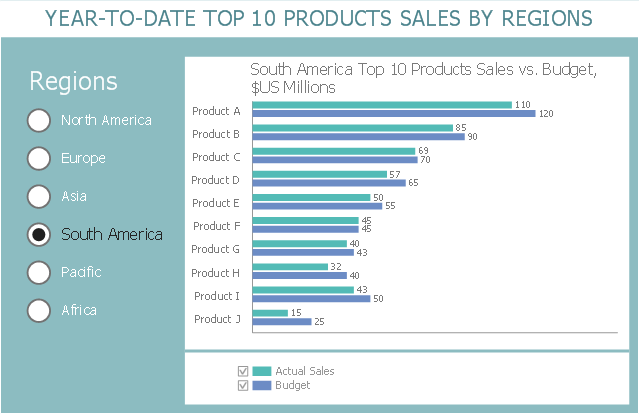
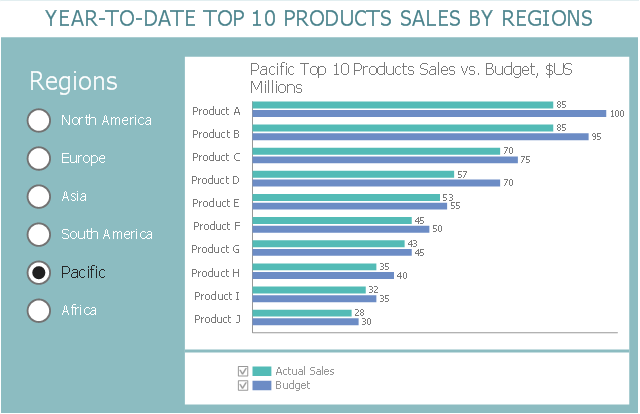
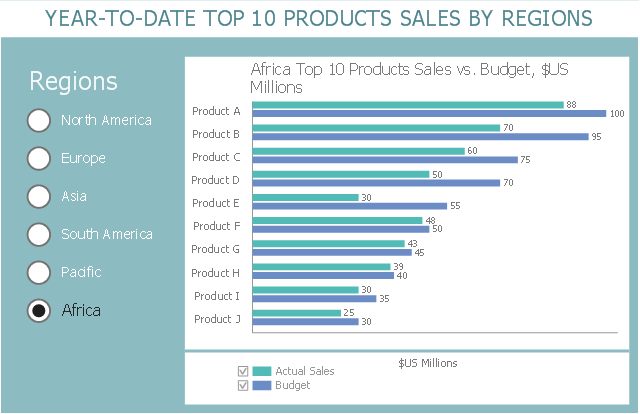
This business intelligence dashboard sample shows the year-to-date top 10 products sales by regions using horizontal bar charts.
"Dashboards often provide at-a-glance views of KPIs (key performance indicators) relevant to a particular objective or business process (e.g. sales, marketing, human resources, or production). In real-world terms, "dashboard" is another name for "progress report" or "report."" [Dashboard (business). Wikipedia]
The BI dashboard example "Year-to-date Top 10 Products Sales by Regions" was created using ConceptDraw PRO software extended with the Business Intelligence Dashboards solution from the Business Processes area of ConceptDraw Solution Park.
North America

Europe
Asia
South America
Pacific
Africa
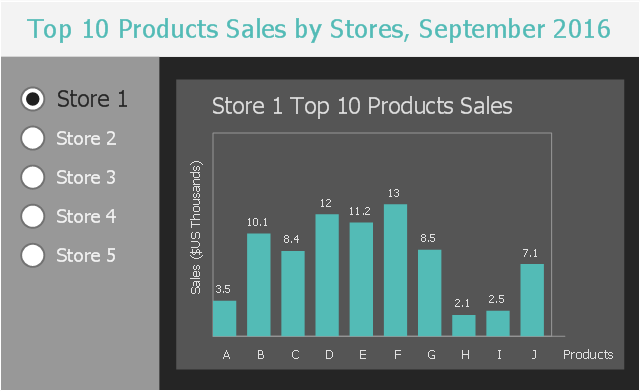
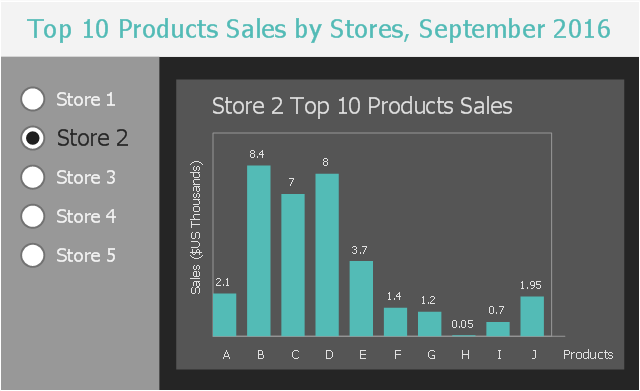
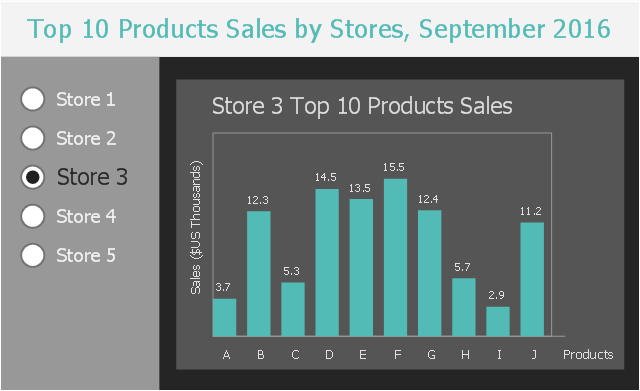
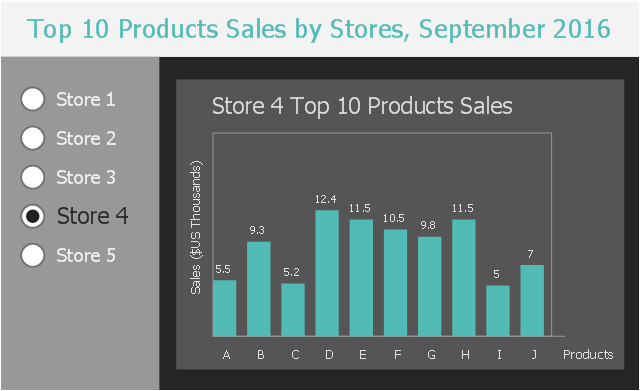
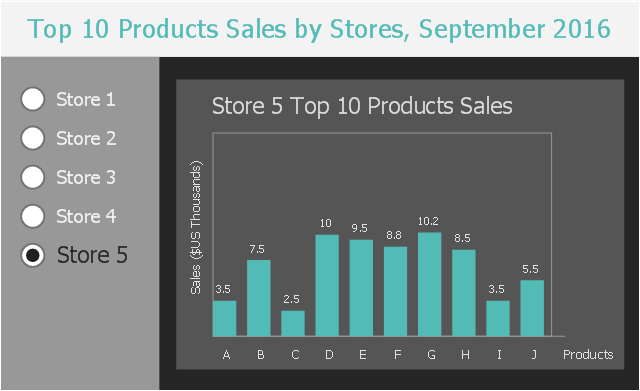
This business intelligence dashboard sample shows the top 10 products sales by stores in September, 2016 using vertical bar charts.
"Bar graphs/ charts provide a visual presentation of categorical data. Categorical data is a grouping of data into discrete groups, such as months of the year, age group, shoe sizes, and animals. These categories are usually qualitative. In a column bar chart, the categories appear along the horizontal axis; the height of the bar corresponds to the value of each category." [Bar chart. Wikipedia]
The BI dashboard example "Top 10 Products Sales by Stores, September 2016" was created using ConceptDraw PRO software extended with the Business Intelligence Dashboards solution from the Business Processes area of ConceptDraw Solution Park.
Store 1
Store 2
Store 3
Store 4
Store 5
Bar Graph

The vector stencils library "Sales dashboard" contains 27 charts and indicators: bar charts, line graphs, gauges, sliders, pie charts, divided bar diagrams, bubble indicators, bullet indicators.
The design elements library "Sales dashboard" for the ConceptDraw PRO diagramming and vector drawing software is included in the Sales Dashboard solution from the Marketing area of ConceptDraw Solution Park.
The design elements library "Sales dashboard" for the ConceptDraw PRO diagramming and vector drawing software is included in the Sales Dashboard solution from the Marketing area of ConceptDraw Solution Park.
Sales dashboard charts and indicators

The vector stencils library "Sales dashboard" contains 27 charts and graphic indicators.
Use it for drawing sales dashboards in the ConceptDraw PRO diagramming and vector drawing software extended with the Sales Dashboard solution from the Marketing area of ConceptDraw Solution Park.
Use it for drawing sales dashboards in the ConceptDraw PRO diagramming and vector drawing software extended with the Sales Dashboard solution from the Marketing area of ConceptDraw Solution Park.
Column Chart

Bar Chart

Line Chart

Divided Bar

Pie Chart

Two Bubbles Indicator

Speedometer Gauge 1

Speedometer Gauge 2

Speedometer Gauge 3

Speedometer Gauge 4

Slider Horizontal 1

Slider Horizontal 2

Slider Horizontal 3

Slider Horizontal 4

Slider Horizontal 5

Slider Horizontal 6

Slider Horizontal 7

Slider Vertical 1

Slider Vertical 2

Slider Vertical 3

Bullet 1

Bullet 2

Bullet 3

Bullet 4

Backgroung 1

Backgroung 2

Backgroung 3

Create Graphs and Charts

Bar Diagram Math

- Sales Growth. Bar Graphs Example | Business Report Pie. Pie Chart ...
- Bar Graphs | Sales Growth. Bar Graphs Example | Financial ...
- Bar Diagrams for Problem Solving. Create economics and financial ...
- Chart Maker for Presentations | Bar Chart Examples | Sales Growth ...
- Sales Growth. Bar Graphs Example | Financial Comparison Chart ...
- Bar Chart Examples | Sales Growth. Bar Graphs Example | Financial ...
- Sales Growth. Bar Graphs Example | Bar Chart Template for Word ...
- Bar Chart Template for Word | Gant Chart in Project Management ...
- Sales Growth. Bar Graphs Example | Bar Graphs | Bar Chart ...
- How to Create a Bar Chart | Sales Growth. Bar Graphs Example ...
- Sales Growth. Bar Graphs Example | Rainfall Bar Chart | Business ...
- Sales Growth. Bar Graphs Example | Bar Chart Examples | Bar ...
- Bar Graphs | Bar Diagrams for Problem Solving. Create event ...
- Business Report Pie. Pie Chart Examples | Pie Chart | Create ...
- Sales Growth. Bar Graphs Example | Bar Chart Template for Word ...
- Create Graphs and Charts | Sales Growth. Bar Graphs Example ...
- Bar Chart Software | Sales Growth. Bar Graphs Example ...
- Financial Comparison Chart | Sales Growth. Bar Graphs Example ...
- Double bar graph - Template | Bar Graph | Bar Chart Examples ...