This site uses cookies. By continuing to browse the ConceptDraw site you are agreeing to our Use of Site Cookies.
Use this onion diagram template with ConceptDraw PRO software to design your stakeholder diagrams.
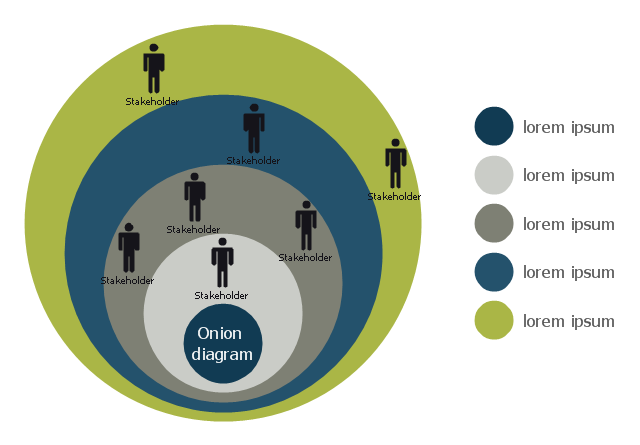
"The Onion Diagram is able to show layers of a complete system in a few circles. Each of the circles is able to represent a component that is dependent upon the component on the inside of it shown by the circle inside of it. The main concept of the diagram is shown by the center circle of the diagram. This chart is used due to the fact that it has a clear visual representation that is easy to read, and it has a strong visual impact." [Onion diagram. Wikipedia]
The stakeholder diagram template "Round onion diagram" is included in the Stakeholder Onion Diagrams solution from the Management area of ConceptDraw Solution Park.
Stakeholder diagram
Stakeholder diagram, stickman, onion diagram, legend,

Onion Diagram Templates

The Onion Diagram is a type of circular diagram which consists of the core circle and concentric circles that look like the cross sections of onion. The key value of the Onion Diagram is to visually demonstrate the relationships that lead to a successful final product or deliverable.
Design of Onion Diagrams and Stakeholder Onions Diagrams is a complex process, but ConceptDraw PRO diagramming and vector drawing software makes it easier thanks to the Stakeholder Onion Diagrams Solution from the Management Area of ConceptDraw Solution Park, and the set of included libraries and Onion Diagram templates.
HelpDesk

How To Make Visio Circle-Spoke Diagram

Circle Spoke Diagram consists from a central round balloon , wich is circled with other balloons as a ring . The Circle Spoke Diagram is usually used in marketing . It shows the relationships of entities and the central element. Circle Spoke Diagram can be used in marketing documentation and presentations. ConceptDraw PRO allows you to easily create marketing charts of any complexity, including the circle-spoke diagram and then make a MS Visio file from your diagram in a few simple steps. You can easily design your business documentation and share it easily with MS Visio users.

How To Create Onion Diagram

An onion diagram is a kind of chart that shows the dependencies among parts of an organization or process. The chart displays items in concentric circles, where the items in each ring depend on the items in the smaller rings. The Onion Diagram is able to show layers of a complete system in a few circles.
But how to create Onion Diagram? Now, it's very easy thanks to the ConceptDraw PRO diagramming and vector drawing software extended with Stakeholder Onion Diagrams Solution from the Management Area of ConceptDraw Solution Park.
HelpDesk

How to Draw a Circle-Spoke Diagram Using ConceptDraw PRO

Making circle-spoke diagram is a very useful technique if you want to explore cause and effect. A Circle-Spoke Diagram is a tool that is often used in marketing sphere. Circle-spoke diagram consists from a central circle surrounded in a round arrangement by related sub-circles. They are used to depict the features or components of a central item in a number of areas. Circle-spoke diagram are widely used in marketing and management documents as well as presentations. A Circle-Spoke Diagram is a very useful tool if you want to perform the Cause and Effect analysis. ConceptDraw PRO delivers the ability to make circle-spoke diagrams of various styles with its Circle-Spoke Diagrams solution.

Stakeholder Management System

Stakeholder management is a critical component to the successful delivery of any project, programme or activity.
ConceptDraw PRO is a powerful diagramming and vector drawing software. Now, thanks to the Stakeholder Onion Diagrams Solution included to the Management Area of ConceptDraw Solution Park, ConceptDraw PRO became also unique stakeholder management system design software.

How To Create Restaurant Floor Plan in Minutes

Restaurant Floor Plans solution for ConceptDraw PRO has 49 extensive restaurant symbol libraries that contains 1495 objects of building plan elements; many examples and templates for drawing floor plans and restaurant layouts.
It helps make a layout for a restaurant — restaurant floor plans, cafe floor plans, bar area, floor plan of a fast food restaurant, restaurant furniture layout, etc.
ConceptDraw PRO — great restaurant floor planner. You do not need to be an artist to create great-looking restaurant floor plans in minutes.
What is ConceptDraw PRO

UML Notation

Unified Modeling Language (UML) is a language of graphic description for object modeling in the field of software engineering. UML was created for definition, visualization, designing of software systems. UML is an open standard that uses graphic notations for creating visual models of object-oriented software systems.
Two types of diagrams are used in UML: Structure Diagrams and Behavior Diagrams. Behavior Diagrams represent the processes proceeding in a modeled environment. Structure Diagrams represent the elements that compose the system.

stakeholder management, stakeholder onion diagram template, onion diagram process design, stakeholder analysis Stakeholder Onion Diagrams

stakeholder management, stakeholder onion diagram template, onion diagram process design, stakeholder analysis
The Stakeholder Onion Diagram is often used as a way to view the relationships of stakeholders to a project goal. A basic Onion Diagram contains a rich information. It shows significance of stakeholders that will have has influence to the success achieve

2014 FIFA World Cup

Thanks to the Soccer solution you can design your own soccer-related drawings, diagrams, schemes in seconds. It’s very simple and convenient because Soccer solution contains incredible quantity of ready-to-use predesigned vector objects, professional templates and samples.
HelpDesk

How to Create a Seating Chart for Wedding or Event

Making the guests invited to a wedding or any other special event feel as comfortable as possible, you necessary to take care of the preparation of the seating arrangements plan. That is why it is important to make a detailed table seating chart that will carefully positioning any invitee. Making a Seating Chart template with a help of seating chart software is the best way to represent and prepare a seating plan, for event participants and guests. The ability to design different seating plans is delivered by the ConceptDraw Seating Plans solution. Using ConceptDraw PRO simplifies the complex and cumbersome process of public events organization.
HelpDesk

How to Connect Objects on PC

ConceptDraw PRO provides a few options for drawing connections between objects: Direct Connectors,
Smart, Arc, Bezier, Curve and Round Connectors. You can connect objects in your ConceptDraw diagram with proper connectors using the embedded automatic connection modes. This article describes how you can connect objects with connectors and how you can ascribe different types and behaviors.
Arrow 10 Technology
Arrow 10 Technology
HelpDesk

How to Set Line Jumps for Smart Connectors in ConceptDraw PRO

Connecting objects in ConceptDraw PRO is an easy task. You can use Chain, or Tree connection mode for automatic connection of multiple objects. Besides the automatic connection modes, ConceptDraw PRO offers few options to connect objects manually: Direct, Arc, Bezier, Smart, Curve and Round Connectors. You can make them square, arched or angled and also set vertical or horizontal orientation Thus, you can control how the jumps and orientation occurs on smart connectors. When two smart connectors cross each other you can control how the two intersecting lines look.

draw pie chart, draw donut chart Pie Charts

draw pie chart, draw donut chart
Pie Charts are extensively used in statistics and business for explaining data and work results, in mass media for comparison (i.e. to visualize the percentage for the parts of one total), and in many other fields. The Pie Charts solution for ConceptDraw PRO v10 offers powerful drawing tools, varied templates, samples, and a library of vector stencils for simple construction and design of Pie Charts, Donut Chart, and Pie Graph Worksheets.

sales process map, sales process flowchart, sales steps, sales process management Sales Flowcharts

sales process map, sales process flowchart, sales steps, sales process management
The Sales Flowcharts solution lets you create and display sales process maps, sales process workflows, sales steps, the sales process, and anything else involving sales process management.