This site uses cookies. By continuing to browse the ConceptDraw site you are agreeing to our Use of Site Cookies.

The Best Flowchart Software Available

ConceptDraw gives the ability to draw Flowchart documents. Flowcharts solutionis a powerful tool that extends ConceptDraw application for drawing business flowcharts.
ConceptDraw DIAGRAM vector diagramming and business graphics software enhanced with with templates, green and interactive flowchart makers, samples and stencil libraries from ConceptDraw Solution Park which all focused to help with drawing flowcharts, block diagrams, bar charts, histograms, pie charts, divided bar diagrams, line graphs, area charts, scatter plots, circular arrows diagrams, Venn diagrams, bubble diagrams, concept maps, and others.

CORRECTIVE ACTIONS PLANNING. Risk Diagram (PDPC)

Risk Diagram (PDPC) - ConceptDraw OFFICE suite is a software for Risks Diagram making. This diagram identifies possible risks in accomplishing corrective actions. With the Risks Diagram, one analyzes each action separately in a tree of all actions and develops a preventive action in response of each potential obstacles or circumstances which may be a risk.
7MP Tools
7MP Tools

Internal Audit Process

Internal auditing is an independent, objective assurance and consulting activity designed to add value and improve an organization's operations.
ConceptDraw DIAGRAM diagramming and vector drawing software extended with Audit Flowcharts solution from the Finance and Accounting area perfectly suits for the Internal Audit Process. You can make sure this right now!

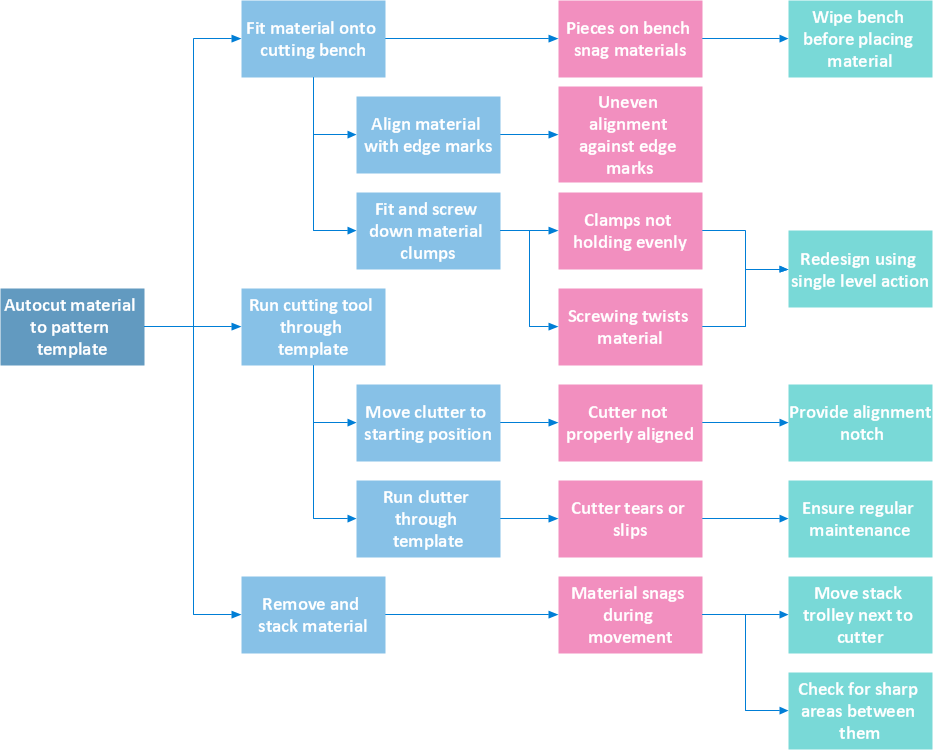
Risk Diagram (Process Decision Program Chart)

Process Decision Program Chart (PDPC) is a commonly used technique that was designed in order to help prepare the contingency plans. The emphasis of the PDPC is identifying the consequential impact of failure on activity plans as well as creating the appropriate contingency plans in terms of limiting the risks. Planning to make the tree diagrams and/or the process diagrams can be extended by a couple of levels when the PDPC can be applied to the bottom level tasks on those diagrams.

Sales Process Flowchart Symbols

The most easier way of creating the visually engaging and informative Sales Process Flowchart is to create the new ConceptDraw document and to use the predesigned vector symbols offered in 6 libraries of the Sales Flowchart Solution. There are more than six types of sales process flow diagrams, ConceptDraw DIAGRAM software is flowchart maker which include six collections of extended flowchart symbols for effective diagramming. There are main collections of color coded flowchart symbols: Sales Department, Sales Steps, Sales Workflow, Sales Symbols and special set of Sales Arrows and Sales Flowchart.

Risk Analysis

Risk Analysis. ConceptDraw OFFICE suite is a software for decision making. The Seven Management and Planning Tools is a tool for Risks Diagram drawing. This diagram identifies possible risks in accomplishing corrective actions. With the Risks Diagram, one analyzes each action separately in a tree of all actions and develops a preventive action in response of each potential obstacles or circumstances which may be a risk.

How To Make a Concept Map

How to make a Concept Map fast and easy? ConceptDraw DIAGRAM diagramming and vector drawing software extended with Concept Maps Solution from the "Diagrams" Area is the best choice for those who want design professional looking Concept Map in minutes.

Best Flowcharts

Flowcharts visualize a process or algorithm of program as step/operation blocks of various shapes connected with arrowed lines showed the process flow direction. They are used to visualize business or technical processes and software algorithms.

Conceptdraw DIAGRAM - feature-rich flowchart software. It will allow you to create professional looking flowcharts.

How to Draw an Effective Flowchart

Use ConceptDraw DIAGRAM diagramming and business graphics software to draw your own flowcharts of business processes.

Use the Best FlowChart Tool for the Job

The ConceptDraw DIAGRAM is a best flow chart tool for the job. The samples and templates included in the basic set allows users to draw any type of a flowchart. The vector stencils created by designers give ability to draw great-looking flowchart. Flowcharts give to users the ability to represent structural data visually.