Copying Service Process Flowchart. Flowchart Examples
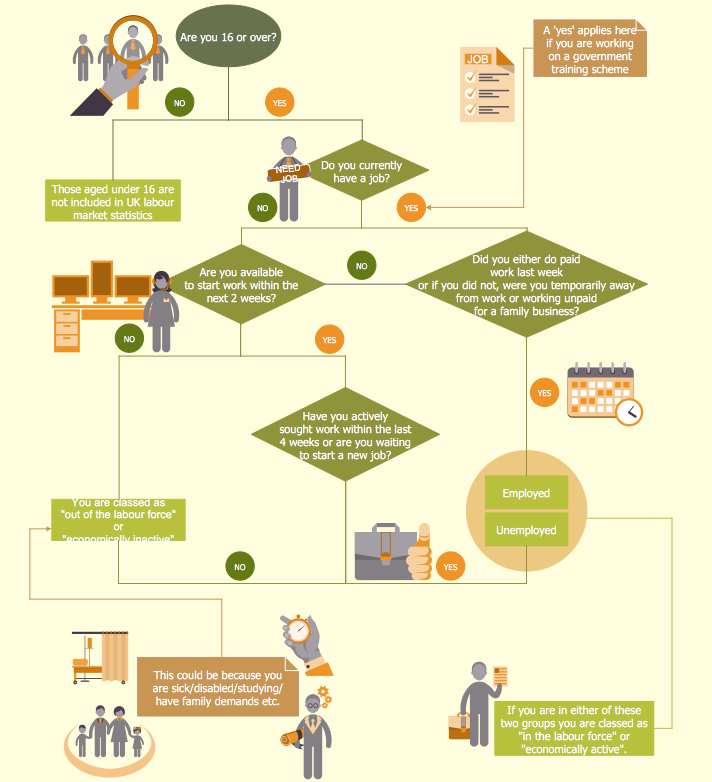
This sample was created in ConceptDraw DIAGRAM diagramming and vector drawing software using the Flowcharts solution from the Diagrams area of ConceptDraw Solution Park. This sample shows the Flowchart on that it is displayed the process of the determination the permissibility according the Access Copyright license. The diamonds represent the decision points. Inside the diamonds are the questions that need the answer yes/no. It is necessary to answer on the question, make the decision that will determine the next step.Selecting & Creating Flowcharts
ConceptDraw Flowcharts visualize a process or algorithm of program as step/operation blocks of various shapes connected with arrowed lines showed the process flow direction. They are used to visualize business or technical processes and software algorithms.Examples of Flowchart
This sample shows the Flowchart of the ACC general account creation. This Flowchart describes the Start point, the process of the handling the user requests and the End point – creating of the account. The shapes represent the subprocesses and the arrows between the shapes shows the sequence of the actions. This sample was created in ConceptDraw DIAGRAM diagramming and vector drawing software using the Flowcharts solution from the "Diagrams" area of ConceptDraw Solution Park.
Flowchart Examples and Templates
ConceptDraw DIAGRAM ector diagramming software and ConceptDraw Solution Park provide a wide variety of diagrams, organizational charts, business charts and flowchart examples, templates and samples. You are free to choose any example or template you are interested in from the ConceptDraw STORE, then use it to simplify your work at the designing professional-looking flowcharts and diagrams. As for flowcharts, turn your attention for the Flowcharts solution from the "Diagrams" area of ConceptDraw Solution Park, Process Flowcharts and Cross-Functional Flowcharts solutions from the Business Processes area, Accounting Flowcharts and Audit Flowcharts solutions from the Finance and Accounting area, which are completely devoted to flowcharts creation and provide an enormous collection of helpful flowchart templates and samples. Each of them is specially developed, well thought-out, dedicated to a certain thematic and carries a specific purpose. You need only to determine with your needs and to decide which one corresponds them the best and suits for you.Flowchart Examples
It’s very simple, convenient and quick to design professional looking Flowcharts of any complexity using the ConceptDraw DIAGRAM diagramming and vector drawing software extended with Flowcharts Solution from the "Diagrams" Area of ConceptDraw Solution Park which provides a wide set of predesigned objects, templates, samples and Flowchart examples.Business Processes
The most worked out and commonly used methodology of business processes description is IDEF methodology. Besides business processes it allows to describe functional blocks, for example production and marketing. ConceptDraw lets creation of business processes description using IDEF0 and IDEF2 methods.Workflow Flowchart Symbols
The Workflow diagrams are the specialized type of flowcharts which allow to visualize any sorts of step-by-step processes. They are usually created as flowcharts, with objects that represent in a simple visual manner the steps in the process connected by arrows that indicate the next step. The ability easily create Workflow diagrams visually describing the tasks, documents associated with the tasks, people which are responsible for execution at each stage of workflow is made possible with Workflow Diagrams solution. This solution extends ConceptDraw DIAGRAM with a Workflow Diagram library that contains large collection of predesigned workflow flowchart symbols.HelpDesk
How to Create a HR Process Flowchart
One of the useful tools of each HR specialist is a HR Process Flowchart. HR Flowchart renders step-by-step the process of Human Resource management in any organization. HR flowchart shows the flow of all HR processes, identifies and standardizes the list of mandatory documents required for the implementation of all HR procedures, including the recruiting process. Usually, the descriptions of entire HR processes in a company requires a big set of graphic documents. They must be regularly redrawn to maintain up to date. The best tool for this is ConceptDraw DIAGRAM - the best software to create process flow diagrams of various types. In conjunction with ConceptDraw HR flowchart solution, it delivers comprehensive tool-set for human resource management.Online Flow Chart
ConceptDraw DIAGRAM diagramming and vector drawing software extended with tools of Flowcharts Solution from the "Diagrams" Area of ConceptDraw Solution Park ideally suits for fast and easy Online Flow Chart designing. We propose to verify this right now.Best Flowchart Software and Flowchart Symbols
For many years ConceptDraw Solution Park delivers a great quantity of high-quality business process flowchart and flow diagram solutions, which are turned the ConceptDraw DIAGRAM into the most comprehensive and powerful software. Now it is an example of the best professional flowchart software available with extensive set of solutions, including the Flowcharts solution. The ConceptDraw solutions contain thousands of standard basic and creative flowchart symbols and other design elements, numerous quick-start templates, samples and examples. ConceptDraw DIAGRAM diagramming and vector graphics software includes specific drawing tools that you need to easily design the flowcharts and diagrams of any complexity and degree of detailing. Use ConceptDraw DIAGRAM to draw your own diagrams, charts, graphs and flowcharts for graphic communication, simple visual presentation of complex structures, numerical data and logical relations, explanation business and personal ideas and concepts, representation step-by-step flows of actions or operations, etc.How to Draw EPC Diagram Quickly
An event-driven process chain diagram is a flowchart used in business process analysis. It evolved from Architecture of Integrated Information Systems (ARIS) and utilised in the business process improvement and analysis. It is also used to facilitate enterprise resource planning. An EPC diagram is a complex flowchart that shows different business processes through various workflows. The workflows are seen as functions and events that are connected by different teams or people, as well as tasks that allow business processes to be executed. ConceptDraw DIAGRAM is a software for making EPC diagrams that allows managers visually present business process models for making decisions for business.
Pyramid Diagram and Pyramid Chart
Pyramid Diagram, Triangle Chart or Triangular Diagram is a convenient and useful type of diagrams, which lets represent the data hierarchical structure and to illustrate the foundation-based relationships between the hierarchy levels. Pyramid Diagrams are used to visualize effectively the hierarchical, as well as proportional and foundation-based relationships, the process steps, the interconnections of organizational layers or topics. ConceptDraw DIAGRAM software enhanced with Pyramid Diagrams solution from Marketing area of ConceptDraw Solution Park is a powerful business charting software, that includes all required tools for designing the multilevel Pyramid Diagrams as quickly as possible. The build-in vector stencils and templates are the great aid for designers, a variety of examples and samples is a good base and source of inspiration. Use attractive and vivid 2D and 3D Pyramid Diagrams and Triangle Charts designed in ConceptDraw DIAGRAM to illustrate your documents, presentations, infographics, articles, reports, websites, etc.Introduction to bookkeeping: Accounting flowchart process
Everything about Bookkeeping: Accounting flowchart process. Which symbols to use, how to make a chart.- Operation Flow Chart Process Of Fast Food Restaurant
- Copying Service Process Flowchart . Flowchart Examples | How To ...
- How To Create Restaurant Floor Plan in Minutes | Process ...
- Types of Flowcharts | Restaurant Floor Plan Software | Sales ...
- Process Flowchart | Basic Flowchart Symbols and Meaning | How To ...
- Process Flow Chart For Food Restaurant Process
- Process Flowchart | Mac Diagramming Software | How To Create ...
- Copying Service Process Flowchart . Flowchart Examples | Cafe and ...
- Process Flowchart | How To Create Restaurant Floor Plan in ...
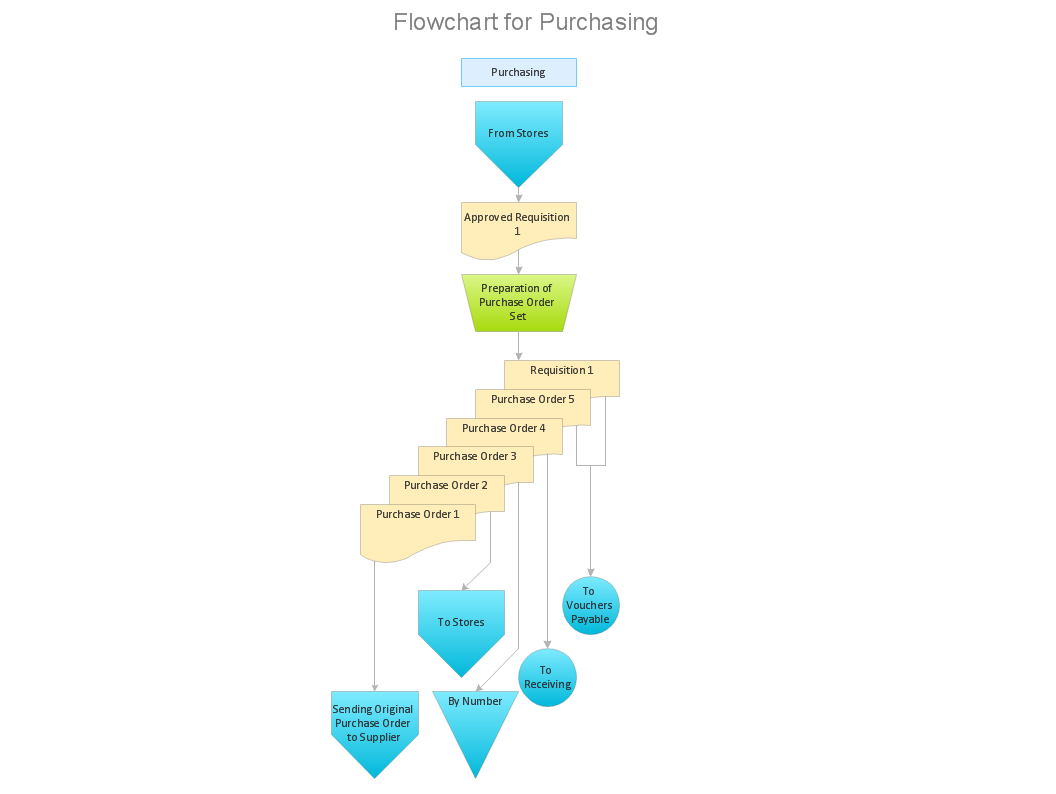
- Restaurant Purchasing Flowchart
- Copying Service Process Flowchart . Flowchart Examples | How To ...
- Process Flowchart | How To Create Restaurant Floor Plan in Minutes
- Process Flowchart | CAD Drawing Software for Making Mechanic ...
- Process Flowchart | Create Flow Chart on Mac | How To Create ...
- Flowchart Software | How To Create Restaurant Floor Plan in ...
- Restaurant Service Process Flow Chart
- Basic Flowchart Symbols and Meaning | Process Flowchart | How To ...
- Data Flow Diagram | How To Create Restaurant Floor Plan in ...
- Copying Service Process Flowchart . Flowchart Examples | How To ...
- How To Create Restaurant Floor Plan in Minutes | Process ...


