This site uses cookies. By continuing to browse the ConceptDraw site you are agreeing to our Use of Site Cookies.

Restaurant Floor Plans

Making design interior restaurant or café floor plan can be hard and very complicated unless you have ConceptDraw DIAGRAM software which can do all drawing for you offering lots of templates, samples of floor plans and many other plans and schemes, including even examples of numerous charts, flowcharts and diagrams.

ConceptDraw Solution Park ConceptDraw Solution Park

ConceptDraw Solution Park
ConceptDraw Solution Park collects graphic extensions, examples and learning materials
HelpDesk

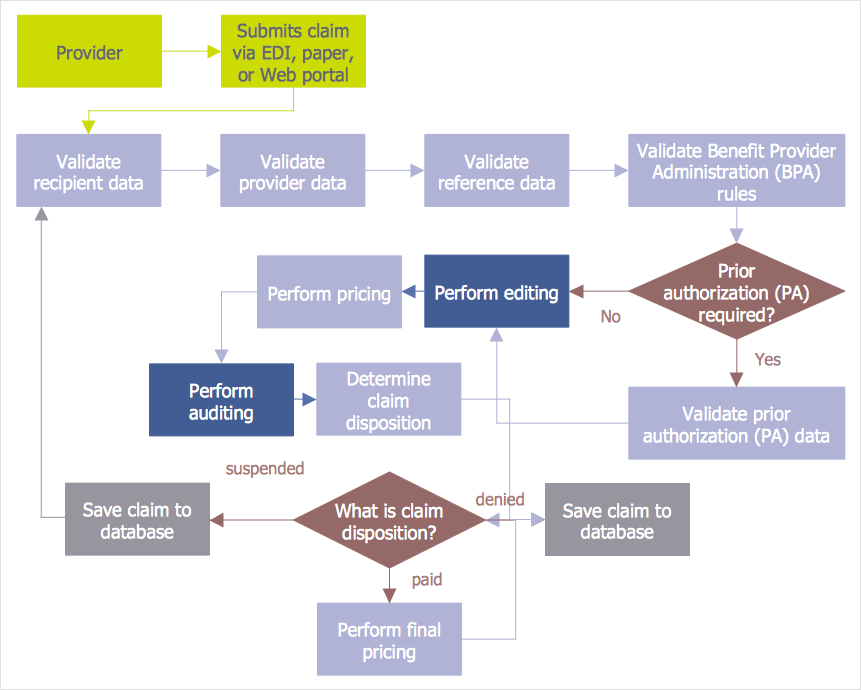
How to Create an Audit Flowchart

Audit flowcharts are often used in auditors activity. This is the most effective way of preparation and documentation of the audit process. Financial audit process has a clear structure, and therefore audit flowchart is often used to denote an audit process. This is the most effective way of preparation and documentation of the audit process. Flowcharts are often used in auditors activity. A flowchart may be created at any stage of an audit process as an aid in the determination and evaluation of a client's accounting system. ConceptDraw DIAGRAM allows you to create professional accounting flowchart quickly using the professional Audit Flowcharts solution.

business clipart, finance clipart Business and Finance

business clipart, finance clipart
Use Business and Finance solution to make professional-looking documents, presentations and websites, business, finance, advertising, and project management illustrations, or any designs that requires clipart of currency, office, business, advertising, management, marketing, people, time, post, contacts, collaboration, etc.

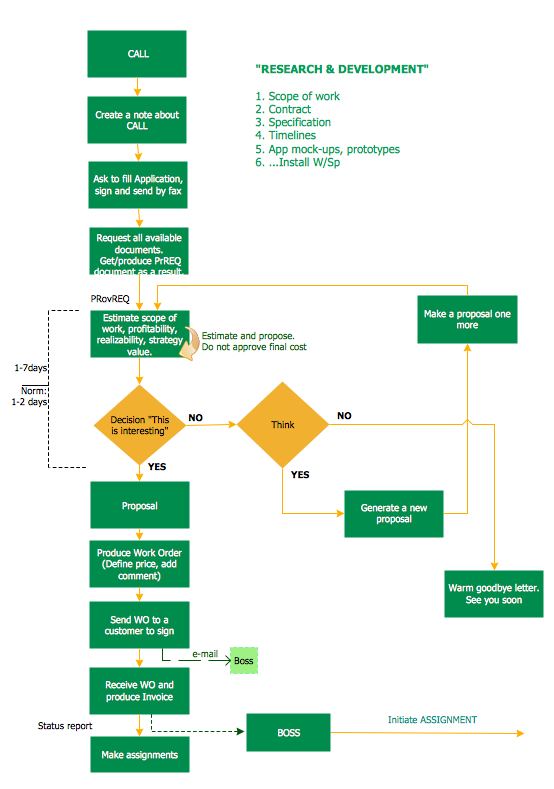
Best Program to Make Workflow Diagrams

ConceptDraw DIAGRAM is the best program to make workflow diagrams. With the new Arrows10 technology it brings features allow you make workflow diagrams faster then ever before. These features allow you to focus on thinking, not drawing, that makes ConceptDraw DIAGRAM the best program to make workflow diagrams.
HelpDesk

How to Create an IDEF0 Diagram for an Application Development

IDEF0 methods are intended to model the functions of a process, creating a graphical model that displays: what controls the function, who makes it, what resources are used and how they are connected with other functions. The IDEF0 tool is used to model the decisions, actions, and activities of a software system during the development process. IDEF0 diagram graphically depicts a model of a desired version of the application. ConceptDraw DIAGRAM allows you to create and communicate the IDEF0 diagrams of any complexity.

quality management mind map, quality management mindmap Quality Mind Map

quality management mind map, quality management mindmap
This solution extends ConceptDraw MINDMAP software with Quality Management Mind Maps (Presentations, Meeting Agendas, Problem to be solved).

Business diagrams & Org Charts with ConceptDraw DIAGRAM

Business flowcharting tool helps you create a flowchart with minimal effort. With ConceptDraw you can make a flowchart, draw data flow diagrams, orgchart professional, process flow diagrams etc - without any prior knowledge or training.
Draw Business Process Diagrams

Financial Trade UML Use Case Diagram Example

This sample represents the actors, use cases and dependencies between them, and also the relationships between use cases. There are used dependency and use case generalization associations on this UML diagram. Use case generalization is used when you have two similar use cases, but one of them does more than another.
This sample shows the work of the Financial Trade sphere and can be used by trading companies, commercial organizations, traders, different exchanges.

Copying Service Process Flowchart. Flowchart Examples

This sample was created in ConceptDraw DIAGRAM diagramming and vector drawing software using the Flowcharts solution from the Diagrams area of ConceptDraw Solution Park.
This sample shows the Flowchart on that it is displayed the process of the determination the permissibility according the Access Copyright license. The diamonds represent the decision points. Inside the diamonds are the questions that need the answer yes/no. It is necessary to answer on the question, make the decision that will determine the next step.

network topology diagram software, network icons, network diagram template, networking icons available, how to draw a network diagram Computer Network Diagrams

network topology diagram software, network icons, network diagram template, networking icons available, how to draw a network diagram
Computer Network Diagrams solution extends ConceptDraw DIAGRAM software with samples, templates and libraries of vector icons and objects of computer network devices and network components to help you create professional-looking Computer Network Diagrams, to plan simple home networks and complex computer network configurations for large buildings, to represent their schemes in a comprehensible graphical view, to document computer networks configurations, to depict the interactions between network's components, the used protocols and topologies, to represent physical and logical network structures, to compare visually different topologies and to depict their combinations, to represent in details the network structure with help of schemes, to study and analyze the network configurations, to communicate effectively to engineers, stakeholders and end-users, to track network working and troubleshoot, if necessary.

data flow diagram, DFD templates Data Flow Diagrams (DFD)

data flow diagram, DFD templates
Data Flow Diagrams solution extends ConceptDraw DIAGRAM software with templates, samples and libraries of vector stencils for drawing the data flow diagrams (DFD).

ERD Symbols and Meanings

Crow's foot notation is used in Barker's Notation, Structured Systems Analysis and Design Method (SSADM) and information engineering. Crow's foot diagrams represent entities as boxes, and relationships as lines between the boxes. Different shapes at the ends of these lines represent the cardinality of the relationship.
The Chen's ERD notation is still used and is considered to present a more detailed way of representing entities and relationships.
To create an ERD, software engineers mainly turn to dedicated drawing software, which contain the full notation resources for their specific database design - ERD symbols and meanings. CS Odessa has released an all-inclusive Entity-Relationship Diagram (ERD) solution for their powerful drawing program, ConceptDraw DIAGRAM.
How to Build an Entity Relationship Diagram (ERD)

Bar Chart Software

The best bar chart software ever is ConceptDraw. ConceptDraw bar chart software provides an interactive bar charting tool and complete set of predesigned bar chart objects.

Accounts Payable Flowchart

Accounts Payable Flowchart - There is nothing easier than do it in ConceptDraw DIAGRAM. ConceptDraw DIAGRAM diagramming and vector drawing software provides the Accounting Flowcharts Solution from the Finance and Accounting Area of ConceptDraw Solution Park.
The Accounting Flowcharts Solution contains templates, samples and library of ready-to-use predesigned vector objects that will help you create: accounts payable flowchart, accounts payable process flow chart, accounting flowchart of any complexity quick and easy.