Financial Comparison Chart
This sample shows the Bar Chart of the leverage ratios for two major investment banks. The leverage ratio is the ratio of the total debt to the total equity; it is a measure of the risk taken by the bank. The higher of the leverage ratio denotes the more risk, the greater risks can lead to the subprime crisis.Feature Comparison Chart Software
An example of marketing analysis diagram, can be used to analyse product market and define marketing strategy. This sample shows the Feature Comparison Chart of the digital scouting cameras. It can be useful for digital cameras production field, marketing, sales, etc.Rainfall Bar Chart
This sample shows the Horizontal Bar Chart of the average monthly rainfalls. This sample was created in ConceptDraw PRO diagramming and vector drawing software using the Bar Graphs Solution from the Graphs and Charts area of ConceptDraw Solution Park.Bar Chart Template for Word
All these bar chart templates are included in the Bar Graphs solution. You can quickly rework these bar graph templates into your own charts by simply changing displayed data, title and legend texts.Column Chart Examples
Column chart examples from ConceptDraw collection can help you find the best visual depiction for you data. You can easily modify column chart examples according to data you want to visualize.Sales Growth. Bar Graphs Example
This sample was created in ConceptDraw PRO diagramming and vector drawing software using the Bar Graphs Solution from Graphs and Charts area of ConceptDraw Solution Park. It is Bar Graphs example, Sales Growth example, Column Chart Example - Sales Report.Purchasing Flow Chart. Purchasing Flowchart Example
This sample shows the Purchasing Flow Chart Diagram that displays the money flow in the carbon offset sphere. The carbon offsets are the compensatory measures that the companies make for the carbon emissions. You can see on this sample the groups that have interests in the carbon offsets and the money flow after the carbon offset vendors sold the carbon offsets.The vector stencils library "Sales KPIs and Metrics" contains 15 chart templates and graphic indicators of sales key performance indicators (KPIs) and metrics for drawing sales dashboards: line charts "Cost per order" and "Clicks from Sales Follow-Up Emails", column charts "Social Media Usage" and "Usage Rate of Marketing Collateral", horizontal bar charts "Rate of Follow Up Contact", "Cost per customer" and "Lead Response Time", pie charts "Product mix", "Product Performance" and "Rate of Contact", gauge (speedometer) indicators "Sales Growth" and "Actual vs Plan", bullet indicator "Sales Target", diamond alarm indicators "Average Purchase Value", "Quote to Close Ratio", "Opportunity-to-Win Ratio" and "Sales Ratio".
The dashboard charts and indicators example "Design elements - Sales KPIs and metrics" for the ConceptDraw PRO diagramming and vector drawing software is included in the Sales Dashboard solution from the Marketing area of ConceptDraw Solution Park.
www.conceptdraw.com/ solution-park/ marketing-sales-dashboard
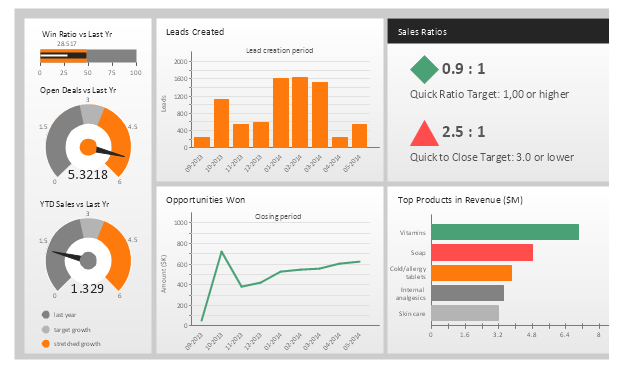
This sales performance dashboard example includes KPIs indicators and business metrics charts: bullet indicator - "Win Ratio vs. Last Year", gauge (speedometer) indicators - "Open Deals vs. Last Year" and "YTD Sales vs. Last Year", column chart - "Leads created", line chart - "Opportunities Won", alarm indicators - "Sales Ratios", horizontal bar chart - "Top Products in Revenue".
The example "Sales performance dashboard" was created using the ConceptDraw PRO diagramming and vector drawing software extended with the Sales Dashboard solution from the Marketing area of ConceptDraw Solution Park.
www.conceptdraw.com/ solution-park/ marketing-sales-dashboard
The example "Sales performance dashboard" was created using the ConceptDraw PRO diagramming and vector drawing software extended with the Sales Dashboard solution from the Marketing area of ConceptDraw Solution Park.
www.conceptdraw.com/ solution-park/ marketing-sales-dashboard
Computer Hardware - Reseller Business Plan
When developing a business plan it is very important to accurately represent the structure and visually outline all important information. A business plan usually has a clear hierarchical structure. The Mind Maps are particularly effective to describe such structures, they are one of the most powerful and visually intuitive tools for the tasks of structuring and memorizing large amounts of information. The Mind Maps are indispensable in development the complex projects, in preparation and discussion of business plans, in designing the presentations, in process of decision making, holding brainstorming, time management, etc. As for the software for working with Mind Maps, particularly effective is a cross-platform ConceptDraw MINDMAP software for Windows and Mac OS X. It provides many tools that help in business plan preparation for organizing the new business, in developing a business plan for promotion some product, etc. ConceptDraw MINDMAP supports the multipage documents, the export and import into popular applications MS PowerPoint, MS Word, PDF, MindManager, in project management applications ConceptDraw Project and MS Project, and in various graphical formats. You can to observe a Mind Map of a business plan for computer hardware reseller designed in ConceptDraw MINDMAP.Bar Diagrams for Problem Solving. Create manufacturing and economics bar charts with Bar Graphs Solution
Create bar charts for visualizing problem solving in manufacturing and economics using the ConceptDraw PRO diagramming and vector drawing software extended with the Bar Graphs Solution from the Graphs and Charts area of ConceptDraw Solition Park.HelpDesk
How to Resize Objects Disproportionately in ConceptDraw PRO
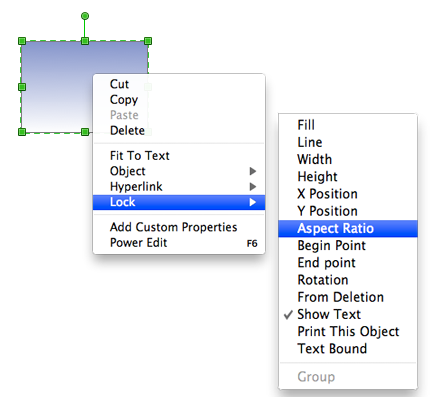
ConceptDraw PRO gives you possibility to freely move, re-size, and rotate objects. You can make them proportionally larger or smaller, as well as re-size objects to make them longer or shorter in only one direction.The vector stencils library "Sales KPIs and Metrics" contains 15 chart templates and graphic indicators of sales key performance indicators (KPIs) and metrics.
Use it for drawing sales dashboards in the ConceptDraw PRO diagramming and vector drawing software extended with the Sales Dashboard solution from the Marketing area of ConceptDraw Solution Park.
Use it for drawing sales dashboards in the ConceptDraw PRO diagramming and vector drawing software extended with the Sales Dashboard solution from the Marketing area of ConceptDraw Solution Park.
Business Productivity - Marketing
Mind Map is effective tool for depiction the main idea and related concepts, and representation a thought process. Mind Maps have essential value in marketing field, advertising and sales. They help successfully accomplish marketing goals and easy get marketing answers, to achieve a sustainable competitive advantages and increasing sales. Mind Maps help in new product development, they allow to generate and structure ideas about its properties and features, to define the target customers, brainstorm the key words and phrases for advertising and sales materials. ConceptDraw MINDMAP is a perfect marketing diagramming and marketing strategy tool that help accomplish marketing goals, represent marketing information and easy design Marketing Mind Maps and Marketing Diagrams (Marketing Step Chart, Marketing Mix Diagram, Market Environment Analysis Charts, Sales Pyramids, Target and Marketing Scope Diagrams, Feature Comparison Chart, Product Position Map, Products Comparison Chart, Timeline, SWOT, Boston Growth Matrix, Ansoff Product-Market Growth Matrix) for further using in visual documents and presentations.HelpDesk
How to Resize Objects in ConceptDraw PRO
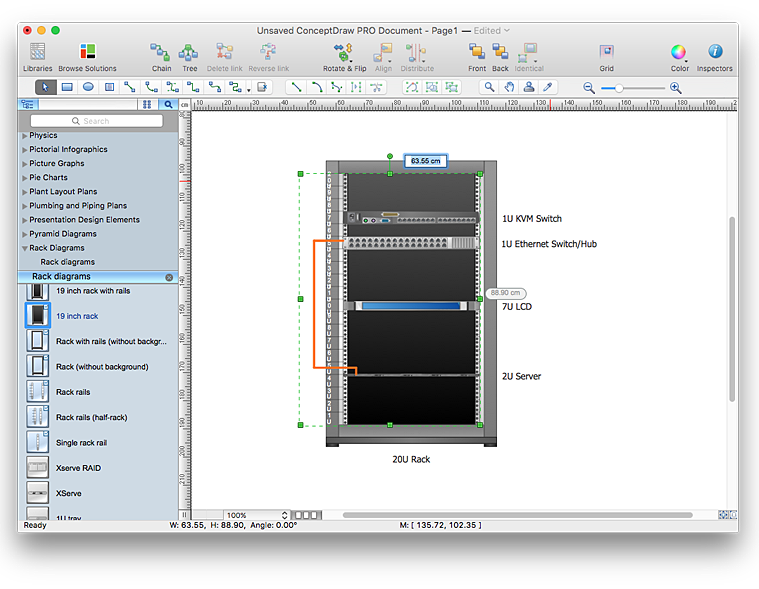
When creating diagram using ConceptDraw PRO, you can select, move, resize and rotate objects. After selecting an object (or objects) in a document, you can change it position, resize it or move an object to the desired position. The sizes of objects in ConceptDraw PRO can be changed by simple dragging, or you can set a particular size of any object. Using ConceptDraw PRO, you can re-size an object on the page using the absolute measurements instead of a mouse. You can make quick work of designing complex drawing using a combination of different-sized items.- Financial Comparison Chart | Rainfall Bar Chart | Bar Chart | Ratio ...
- Financial Comparison Chart | Bar Graph Ratio In Accounts
- Rainfall Bar Chart | Financial Comparison Chart | Bar Chart ...
- Financial Comparison Chart | Rainfall Bar Chart | Purchasing Flow ...
- Financial Comparison Chart | Purchasing Flow Chart . Purchasing ...
- Financial Comparison Chart | Bar Diagrams for Problem Solving ...
- Sales Growth. Bar Graphs Example | Business Report Pie. Pie Chart ...
- Financial Comparison Chart | Design elements - Sales KPIs and ...
- Feature Comparison Chart Software | Bar Chart Template for Word ...
- Rainfall Bar Chart | Financial Comparison Chart | Bar Diagrams for ...
- Feature Comparison Chart Software | Financial Comparison Chart ...
- Purchasing Flow Chart . Purchasing Flowchart Example | Financial ...
- Feature Comparison Chart Software | Rainfall Bar Chart | Design ...
- Financial Comparison Chart | Sales Growth. Bar Graphs Example ...
- Sales Growth. Bar Graphs Example | Financial Comparison Chart ...
- Financial Comparison Chart | Rainfall Bar Chart | UML Class ...
- Financial Comparison Chart | Percentage Pie Chart . Pie Chart ...
- Flowchart Example: Flow Chart of Marketing Analysis | Marketing ...
- Comparison Dashboard | Feature Comparison Chart Software ...
- How To Draw Building Plans | Prepare A Chart Related To Ratio


