Feature Comparison Chart Software

Rainfall Bar Chart

The vector stencils library "Sales KPIs and Metrics" contains 15 chart templates and graphic indicators of sales key performance indicators (KPIs) and metrics for drawing sales dashboards: line charts "Cost per order" and "Clicks from Sales Follow-Up Emails", column charts "Social Media Usage" and "Usage Rate of Marketing Collateral", horizontal bar charts "Rate of Follow Up Contact", "Cost per customer" and "Lead Response Time", pie charts "Product mix", "Product Performance" and "Rate of Contact", gauge (speedometer) indicators "Sales Growth" and "Actual vs Plan", bullet indicator "Sales Target", diamond alarm indicators "Average Purchase Value", "Quote to Close Ratio", "Opportunity-to-Win Ratio" and "Sales Ratio".
The dashboard charts and indicators example "Design elements - Sales KPIs and metrics" for the ConceptDraw PRO diagramming and vector drawing software is included in the Sales Dashboard solution from the Marketing area of ConceptDraw Solution Park.
www.conceptdraw.com/ solution-park/ marketing-sales-dashboard
Sales dashboard charts and graphic indicators

Bar Chart

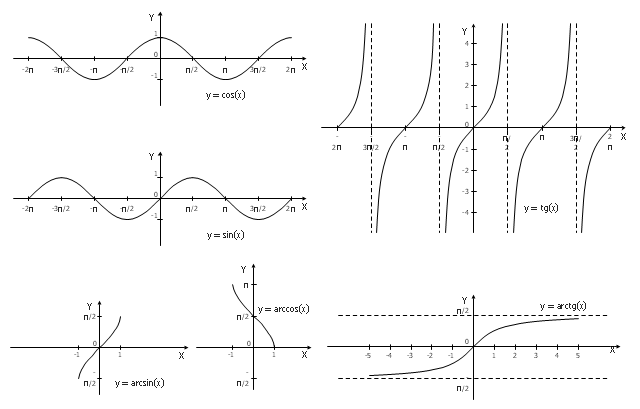
The vector stencils library "Trigonometric functions" contains 8 shapes of trigonometrical and inverse trigonometrical functions graphs.
"In mathematics, the trigonometric functions (also called the circular functions) are functions of an angle. They relate the angles of a triangle to the lengths of its sides. Trigonometric functions are important in the study of triangles and modeling periodic phenomena, among many other applications.
The most familiar trigonometric functions are the sine, cosine, and tangent. In the context of the standard unit circle with radius 1 unit, where a triangle is formed by a ray originating at the origin and making some angle with the x-axis, the sine of the angle gives the length of the y-component (the opposite to the angle or the rise) of the triangle, the cosine gives the length of the x-component (the adjacent of the angle or the run), and the tangent function gives the slope (y-component divided by the x-component). More precise definitions are detailed below. Trigonometric functions are commonly defined as ratios of two sides of a right triangle containing the angle, and can equivalently be defined as the lengths of various line segments from a unit circle. More modern definitions express them as infinite series or as solutions of certain differential equations, allowing their extension to arbitrary positive and negative values and even to complex numbers." [Trigonometric functions. Wikipedia]
The shapes example "Design elements - Trigonometric functions" was created using the ConceptDraw PRO diagramming and vector drawing software extended with the Mathematics solution from the Science and Education area of ConceptDraw Solution Park.
Trigonometrical and inverse trigonometrical functions - Graphs
Flowchart on Bank. Flowchart Examples


Emergency Plan


Bar Diagrams for Problem Solving. Create manufacturing and economics bar charts with Bar Graphs Solution

UML Class Diagrams. Diagramming Software for Design UML Diagrams


How To Draw Building Plans

 Sport Field Plans
Construction of sport complex, playgrounds, sport school, sport grounds and fields assumes creation clear plans, layouts, or sketches. In many cases you need represent on the plan multitude of details, including dimensions, placement of bleachers, lighting, considering important sport aspects and other special things.
Best Mind Mapping Program for Making Presentations

UML Use Case Diagram. Design Elements
")
Design Elements for UML Diagrams

 Logistics Flow Charts
Logistics Flow Charts solution extends ConceptDraw PRO v11 functionality with opportunities of powerful logistics management software. It provides large collection of predesigned vector logistic symbols, pictograms, objects and clipart to help you design with pleasure Logistics flow chart, Logistics process flow diagram, Inventory flow chart, Warehouse flowchart, Warehouse management flow chart, Inventory control flowchart, or any other Logistics diagram. Use this solution for logistics planning, to reflect logistics activities and processes of an enterprise or firm, to depict the company's supply chains, to demonstrate the ways of enhancing the economic stability on the market, to realize logistics reforms and effective products' promotion.
- Sales Growth. Bar Graphs Example | Bar Chart Examples | Business ...
- Financial Comparison Chart | Design elements - Sales KPIs and ...
- Economics Graph Maker Software Free Download
- Rate Bar Graph Design
- Graphic Designer Kpis
- Bar Graphs | Sales Growth. Bar Graphs Example | Picture Graphs ...
- Sales Growth. Bar Graphs Example | Financial Comparison Chart ...
- Ratio Chart Design
- Flowchart Example: Flow Chart of Marketing Analysis | Marketing ...
- Feature Comparison Chart Software | Financial Comparison Chart ...
- Circle Bar Graphs
- Polar Graph | Export from ConceptDraw MINDMAP to PowerPoint ...
- Graphic Designer Kpi Examples
- Financial Comparison Chart | Bar Diagrams for Problem Solving ...
- Economic Graph Maker
- Financial Comparison Chart | Percentage Pie Chart . Pie Chart ...
- Percentage Pie Chart . Pie Chart Examples | Pie Chart Software ...
- How to Draw a Line Graph | The Best Drawing Program for Mac | Bar ...
- Graphic Design How To Design A Dashboard
- Rainfall Bar Chart | Bar Graph | Picture Graphs | Bar Graph Image ...