Quality Criteria MindMap
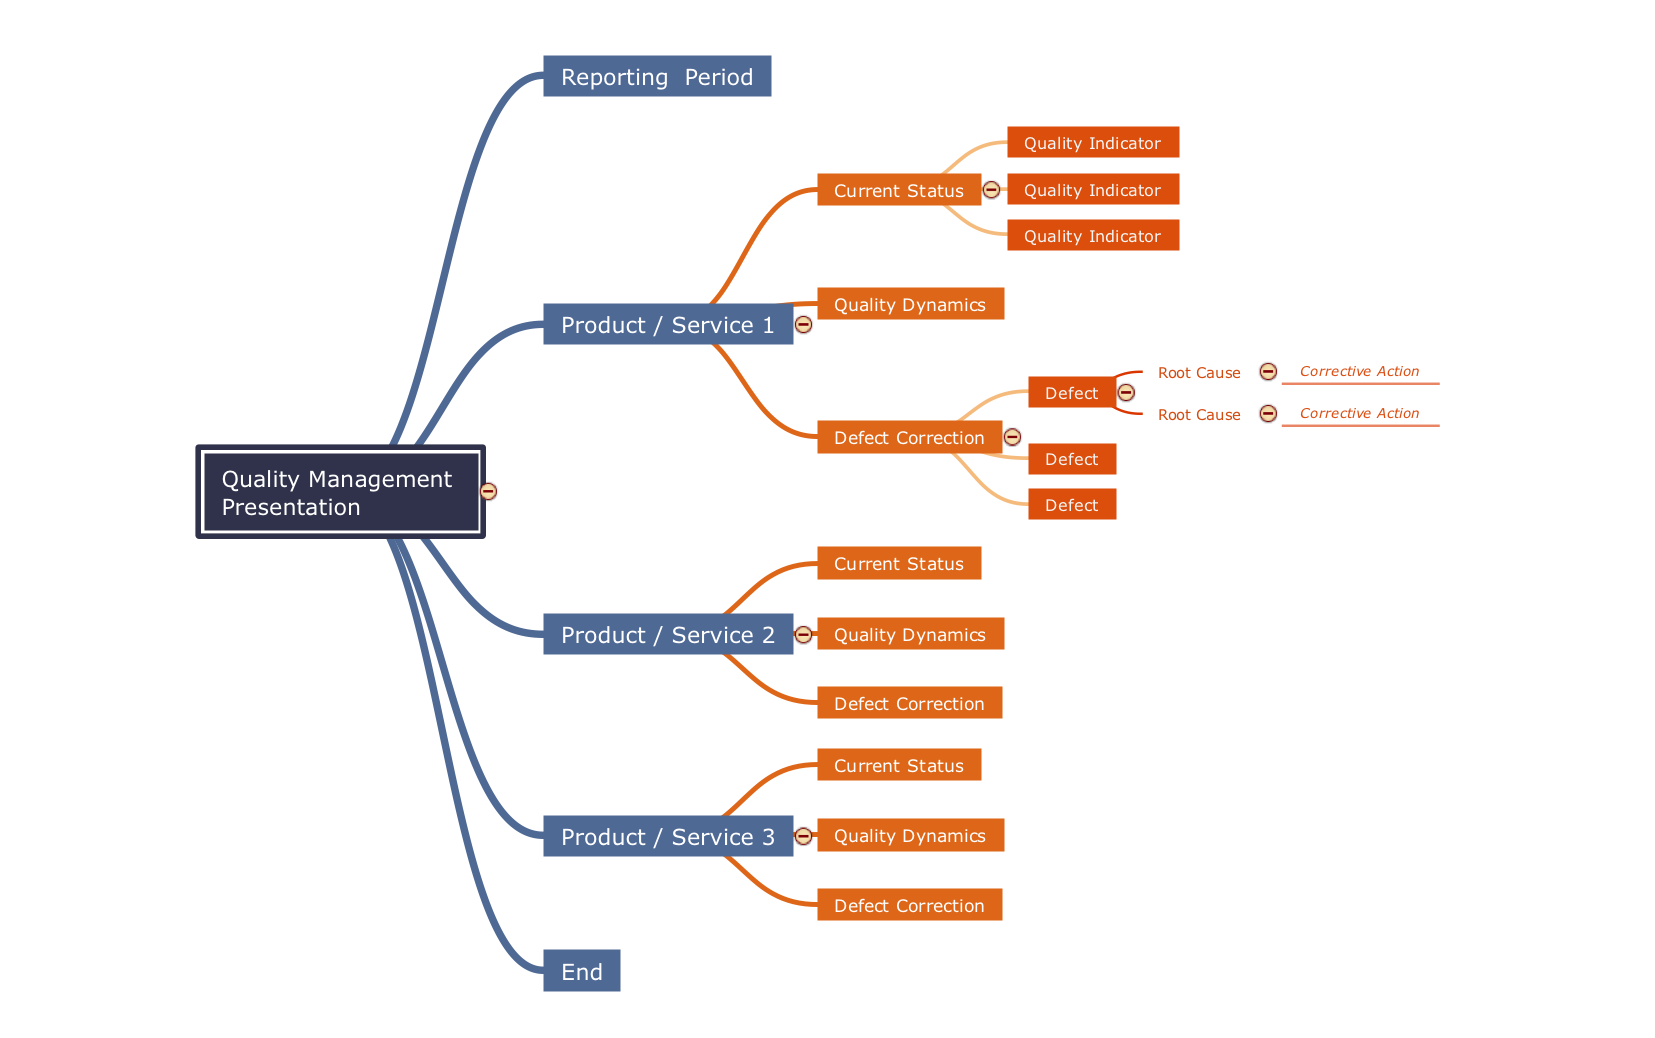
Quality Improvement
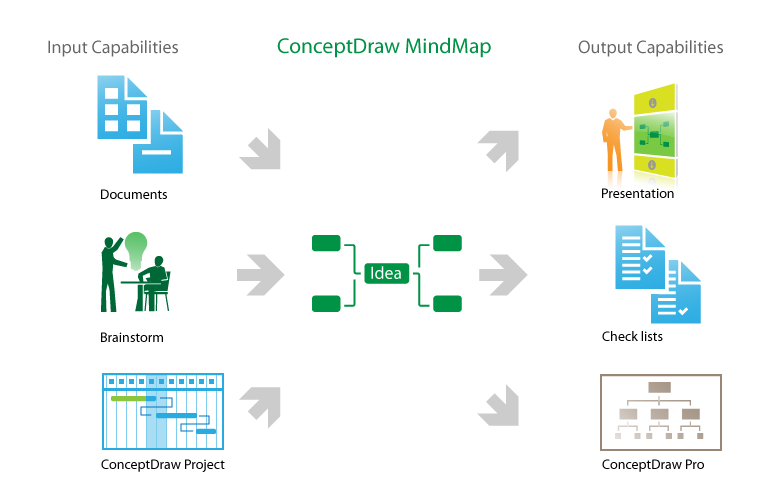
How to make great presentation via Skype? ...how it works with ConceptDraw MINDMAP?
CORRECTIVE ACTIONS PLANNING. Risk Diagram (PDPC)


Decision Making Software For Small Business


Total Quality Management with ConceptDraw

 Pie Charts
Pie Charts are extensively used in statistics and business for explaining data and work results, in mass media for comparison (i.e. to visualize the percentage for the parts of one total), and in many other fields. The Pie Charts solution for ConceptDraw DIAGRAM offers powerful drawing tools, varied templates, samples, and a library of vector stencils for simple construction and design of Pie Charts, Donut Chart, and Pie Graph Worksheets.
Prioritization Matrix

 Bubble Diagrams
Bubble diagrams have enjoyed great success in software engineering, architecture, economics, medicine, landscape design, scientific and educational process, for ideas organization during brainstorming, for making business illustrations, presentations, planning, design, and strategy development. They are popular because of their simplicity and their powerful visual communication attributes.
Metropolitan area networks (MAN). Computer and Network Examples
. Computer and Network Examples")

- Quality Criteria MindMap | Decision Making Software For Small ...
- Mind Map - Quality Structure | Quality Criteria MindMap ...
- Decision Making | CORRECTIVE ACTIONS PLANNING. Risk ...
- Mind Map - Quality Structure | Fundamental Tool in Quality ...
- Mind Mapping Quality
- Total Quality Management TQM Diagrams | Quality Mind Map | Total ...
- Quality Mind Maps - samples and templates | Quality Improvement ...
- Quality Project Management with Mind Maps | Total Quality ...
- Quality Mind Map | Mind Mapping in the Quality Management ...
- Mind Map Problem Solving And Decision Making Total Quality
- Total Quality Management Value | Quality Improvement | Quality ...
- Helpful in all stages of quality management | Quality issues in heir ...
- How To Do A Mind Map In PowerPoint | SWOT Analysis | Quality ...
- Mind Map - Quality Structure | Quality Management Teams | How to ...
- Quality Management Teams | Mind Mapping in the Quality ...
- Quality Mind Map | Quality Project Management with Mind Maps ...
- Quality Of Performance Mind Maps
- Quality Mind Maps - samples and templates | Quality Improvement ...
- Quality Performance Mind Maps
- Quality Mind Map | Group Collaboration Software | Management ...