HelpDesk
How to Create a Timeline Diagram

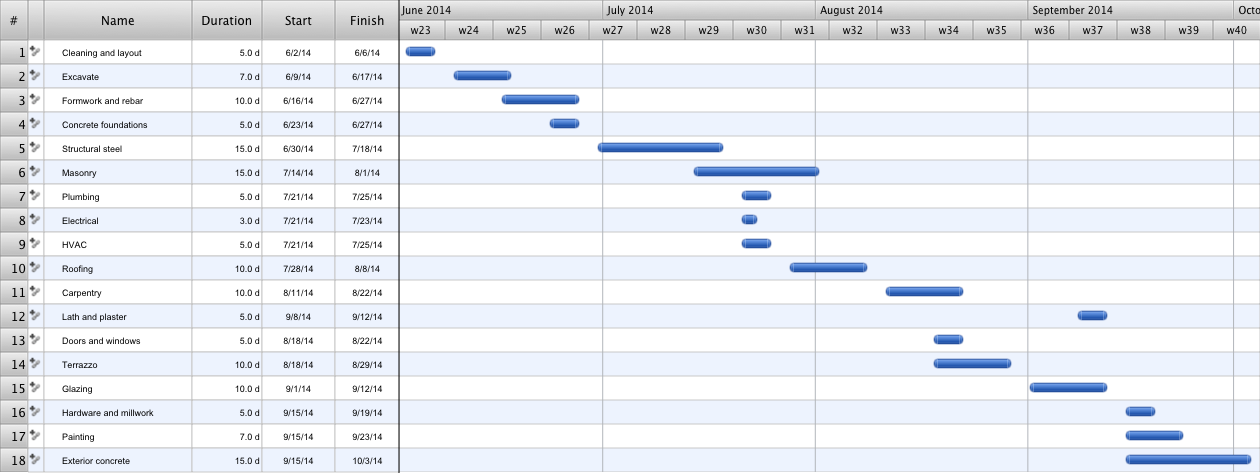
Project Timeline

 Timeline Diagrams
Timeline Diagrams solution extends ConceptDraw DIAGRAM diagramming software with samples, templates and libraries of specially developed smart vector design elements of timeline bars, time intervals, milestones, events, today marker, legend, and many other elements with custom properties, helpful for professional drawing clear and intuitive Timeline Diagrams. Use it to design simple Timeline Diagrams and designate only the main project stages, or highly detailed Timeline Diagrams depicting all project tasks, subtasks, milestones, deadlines, responsible persons and other description information, ideal for applying in presentations, reports, education materials, and other documentation.
How to Make a Timeline

HelpDesk
How to Create a Gantt Chart for Your Project

Timeline Diagrams

The vector stencils library "Timelines and milestones" contains 24 shapes of time scales with start and finish dates, time interval bars with progress indication and brackets, milestone, event and today markers for drawing the timeline diagrams using the ConceptDraw PRO diagramming and vector drawing software.
"A timeline is a way of displaying a list of events in chronological order, sometimes described as a project artifact. It is typically a graphic design showing a long bar labelled with dates alongside itself and (usually) events labelled on points where they would have happened. ...
Another type of timeline is used for project management. In these cases, timelines are used to help team members to know what milestones need to be achieved and under what time schedule. For example, in the case of establishing a project timeline in the implementation phase of the life cycle of a computer system." [Timeline. Wikipedia]
The example "Design elements - Timelines solution" is included in the Timeline Diagrams solution from the Management area of ConceptDraw Solution Park.
Timeline and milestone symbols

Business diagrams & Org Charts with ConceptDraw DIAGRAM


Advanced printing in ConceptDraw PROJECT

Gantt Chart Software

Construction Project Chart Examples
Daily Schedule Chart

Timeline Examples

HelpDesk
How to Shift Dates in ConceptDraw PROJECT

HelpDesk
How to Draw a Gantt Chart

- Timeline Diagrams | How to Make a Timeline | Project Timeline ...
- Timeline diagram | Timeline Diagrams | Project Timeline | Milestone ...
- Project timeline diagram - New business project plan | Project ...
- Project Management Timelines
- How to Create a Timeline Diagram in ConceptDraw PRO | Timeline ...
- How to Create a Timeline Diagram in ConceptDraw PRO | Project ...
- Project plan timeline - Request for proposal (RFP) | PERT chart ...
- Timeline Diagrams | Project Timeline | Design elements - Timelines ...
- Timeline Diagrams | How to Make a Timeline | Project Timeline ...
- Timeline Examples | How to Make a Timeline | Timeline Diagrams ...
- Project Timeline | Timeline Examples | Timeline Diagrams | Project ...
- How to Create a Timeline Diagram in ConceptDraw PRO | How to ...
- How to Make a Timeline | How to Create a Timeline Diagram in ...
- Timeline Examples | Project Timeline | Timeline Diagrams | Sample ...
- Timeline Diagrams | How to Make a Timeline | Timeline Diagrams ...
- How to Make a Timeline | Timeline Diagrams | Project Timeline ...
- How to Identify Project Milestones | How to Create a Timeline ...
- Timeline - Template | Project Timeline | Timeline Examples ...
- Sample Timelines