"The RFP presents preliminary requirements for the commodity or service, and may dictate to varying degrees the exact structure and format of the supplier's response. Effective RFPs typically reflect the strategy and short/ long-term business objectives, providing detailed insight upon which suppliers will be able to offer a matching perspective. ...
RFP:
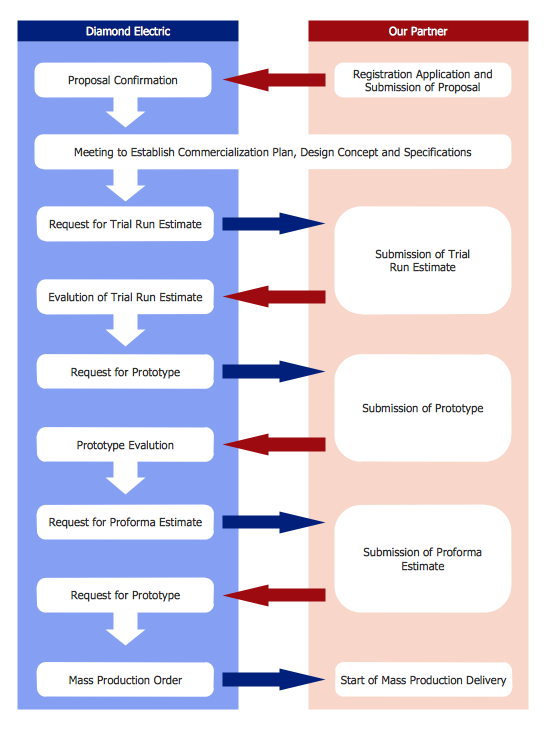
(1) informs suppliers that an organization is looking to procure and encourages them to make their best effort.
(2) requires the company to specify what it proposes to purchase. If the requirements analysis has been prepared properly, it can be incorporated quite easily into the Request document.
(3) alerts suppliers that the selection process is competitive.
(4) allows for wide distribution and response.
(5) ensures that suppliers respond factually to the identified requirements.
(6) is generally expected to follow a structured evaluation and selection procedure, so that an organization can demonstrate impartiality - a crucial factor in public sector procurements." [Request for proposal. Wikipedia]
The project plan timeline diagram example "Request for proposal (RFP)" was created using the ConceptDraw PRO diagramming and vector drawing software extended with the Timeline Diagrams solution from the Management area of ConceptDraw Solution Park.
RFP:
(1) informs suppliers that an organization is looking to procure and encourages them to make their best effort.
(2) requires the company to specify what it proposes to purchase. If the requirements analysis has been prepared properly, it can be incorporated quite easily into the Request document.
(3) alerts suppliers that the selection process is competitive.
(4) allows for wide distribution and response.
(5) ensures that suppliers respond factually to the identified requirements.
(6) is generally expected to follow a structured evaluation and selection procedure, so that an organization can demonstrate impartiality - a crucial factor in public sector procurements." [Request for proposal. Wikipedia]
The project plan timeline diagram example "Request for proposal (RFP)" was created using the ConceptDraw PRO diagramming and vector drawing software extended with the Timeline Diagrams solution from the Management area of ConceptDraw Solution Park.
Project timeline
.png--diagram-flowchart-example.png)
Activity Network Diagram Method

Activity Network (PERT) Chart

Project —Task Trees and Dependencies

Product Proposal Template
UML Class Diagram Example - Buildings and Rooms

Affinity Diagram

 Seven Management and Planning Tools
Seven Management and Planning Tools solution extends ConceptDraw DIAGRAM and ConceptDraw MINDMAP with features, templates, samples and libraries of vector stencils for drawing management mind maps and diagrams.
Network Visualization with ConceptDraw DIAGRAM

IDEF0 Flowchart Symbols

Seven Basic Tools of Quality — Quality Control

Quality Control Chart Software — ISO Flowcharting

Table Seating Chart Template

Garrett IA Diagrams with ConceptDraw DIAGRAM

- Project plan timeline - Request for proposal ( RFP ) | PERT chart ...
- Rfp Response Sample Project Plan Gantt Chart
- Project Timeline | Project plan timeline - Request for proposal ( RFP ...
- Project plan timeline - Request for proposal ( RFP ) | Project timeline ...
- Project plan timeline - Request for proposal ( RFP ) | Timeline ...
- Project plan timeline - Request for proposal ( RFP ) | Activity Network ...
- Project plan timeline - Request for proposal ( RFP ) | Program ...
- Request for proposal ( RFP )
- How to Create a Timeline Diagram in ConceptDraw PRO | Project ...
- Project timeline diagram - New business project plan | Project plan ...
- How to Track Your Project Plan vs. the Actual Project Condition ...
- Rfp In Project Management Example
- Timeline diagram - Project schedule
- Sample Gant Chart For Networking Project Proposals
- Gantt Chart Software | Seating Chart Template | Project — Assigning ...
- Activity Network Diagram Method | PERT Chart Software | UML ...
- Free Online Project Scheduling Software
- PERT chart - Project management plan | PERT chart - Template ...
- Streamlining The Rfp Response Process Flow Chart
- Online Project Planning Tool