The Best Drawing Program for Mac

Best Program to Make Diagrams


Basic Diagramming


Basic Diagramming

Best Diagramming Software for macOS

Basic Diagramming

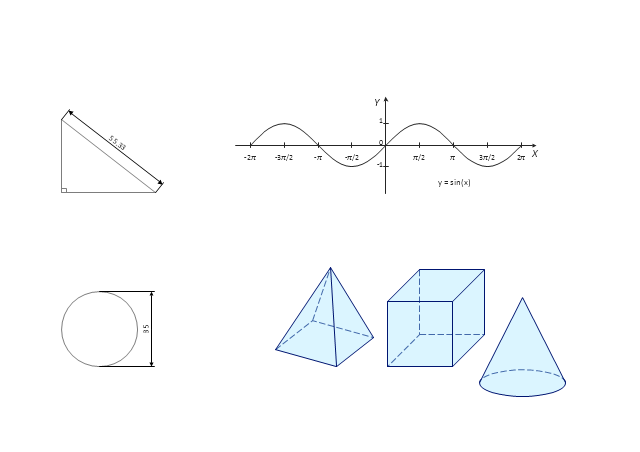
Use this mathematical drawings and graphs template to create your own math illustrations using the shapes of plane and solid geometric figures as well as trigonometric functions.
"Mathematical visualization or mathematical visualization is an aspect of geometry which allows one to understand and explore mathematical phenomena via visualization. Classically this consisted of two-dimensional drawings or building three-dimensional models (particularly plaster models in the 19th and early 20th century), while today it most frequently consists of using computers to make static two or three dimensional drawings, animations, or interactive programs. Writing programs to visualize mathematics is an aspect of computational geometry." [Mathematical visualization. Wikipedia]
The math illustrations template for the ConceptDraw PRO diagramming and vector drawing software is included in the Mathematics solution from the Science and Education area of ConceptDraw Solution Park.
Mathematical drawings and graphs
 ConceptDraw Solution Park
ConceptDraw Solution Park collects graphic extensions, examples and learning materials
 Cross-Functional Flowcharts
Cross-functional flowcharts are powerful and useful tool for visualizing and analyzing complex business processes which requires involvement of multiple people, teams or even departments. They let clearly represent a sequence of the process steps, the order of operations, relationships between processes and responsible functional units (such as departments or positions).
 Universal Diagramming Area
This area collects solutions for drawing diagrams, charts, graphs, matrices, geographic and road maps for education, science, engineering, business.
 Football
The Football Solution extends ConceptDraw DIAGRAM software with samples, templates, and libraries of vector objects for drawing football (American) diagrams, plays schemas, and illustrations. It can be used to make professional looking documen
 Metro Map
Metro Map solution extends ConceptDraw DIAGRAM software with templates, samples and library of vector stencils for drawing the metro maps, route maps, bus and other transport schemes, or design tube-style infographics.
 Flowcharts
The Flowcharts solution for ConceptDraw DIAGRAM is a comprehensive set of examples and samples in several varied color themes for professionals that need to represent graphically a process. Solution value is added by the basic flow chart template and shapes' libraries of flowchart notation. ConceptDraw DIAGRAM flow chart creator lets one depict the processes of any complexity and length, as well as design the Flowchart either vertically or horizontally.
 Business Processes Area
Solutions of Business Processes area extend ConceptDraw DIAGRAM software with samples, templates and vector stencils libraries for drawing business process diagrams and flowcharts for business process management.
- Create Graphs and Charts | Basic Diagramming | The Best Drawing ...
- Line Graph Charting Software | Basic Diagramming | How to Create ...
- Create Graphs and Charts | Basic Diagramming | Line Graph ...
- Create Graphs and Charts | The Best Drawing Program for Mac ...
- Create Graphs and Charts | Best Vector Drawing Application for Mac ...
- Create Flow Chart on Mac | Flowchart Program Mac | Create Graphs ...
- The Best Drawing Program for Mac | Scatter Chart Examples | Line ...
- Line graph template | Line Graph Charting Software | Line Graphs |
- Best Program to Make Diagrams | Basic Diagramming | Visual ...
- Best Multi-Platform Diagram Software | Create Graphs and Charts ...
- Picture graph template | Basic Diagramming | The Best Drawing ...
- Area Charts | Best Software to Draw Diagrams | The Best Drawing ...
- The Best Drawing Program for Mac | Bar Chart Software | Column ...
- Create Graphs and Charts | The Best Mac Software for Diagramming ...
- Basic Diagramming | Flowchart Example: Flow Chart of Marketing ...
- How to Create a Scatter Chart | Scatter Chart Examples | Line Graph ...
- Line Graphs | Line Graph Charting Software | Line graph template |
- Line Chart Examples | How to Create a Line Chart | Line Graph ...
- Create Graphs and Charts | Basic Diagramming | Sales Growth. Bar ...
- Product life cycle graph | Product life cycle graph template | Draw