Basic Flowchart Symbols and Meaning
Flowcharts are the best for visually representation the business processes and the flow of a custom-order process through various departments within an organization. ConceptDraw PRO diagramming and vector drawing software extended with Flowcharts solution offers the full set of predesigned basic flowchart symbols which are gathered at two libraries: Flowchart and Flowcharts Rapid Draw. Among them are: process, terminator, decision, data, document, display, manual loop, and many other specific symbols. The meaning for each symbol offered by ConceptDraw gives the presentation about their proposed use in professional Flowcharts for business and technical processes, software algorithms, well-developed structures of web sites, Workflow diagrams, Process flow diagram and correlation in developing on-line instructional projects or business process system. Use of ready flow chart symbols in diagrams is incredibly useful - you need simply drag desired from the libraries to your document and arrange them in required order. There are a few serious alternatives to Visio for Mac, one of them is ConceptDraw PRO. It is one of the main contender with the most similar features and capabilities.
Types of Flowcharts
A Flowchart is a graphical representation of process, algorithm, workflow or step-by-step solution of the problem. It shows the steps as boxes of various kinds and connects them by arrows in a defined order depicting a flow. There are twelve main Flowchart types: Basic Flowchart, Business Process Modeling Diagram (BPMN), Cross Functional Flowchart, Data Flow Diagram (DFD), IDEF (Integrated DEFinition) Flowchart, Event-driven Process Chain (EPC) Diagram, Influence Diagram (ID), Swimlane Flowchart, Process Flow Diagram (PFD), Specification and Description Language (SDL) Diagram, Value Stream Mapping, Workflow Diagram. Using the Flowcharts solution from the Diagrams area of ConceptDraw Solution Park you can easy and quickly design a Flowchart of any of these types. This solution offers a lot of special predesigned vector symbols for each of these widely used notations. They will make the drawing process of Flowcharts much easier than ever. Pay also attention for the included collection of ready Flowchart examples, samples and quick-start templates. This is business process improvement tools. If you are looking for MS Visio for your Mac, then you are out of luck, because it hasn't been released yet. However, you can use Visio alternatives that can successfully replace its functions. ConceptDraw PRO is an alternative to MS Visio for Mac that provides powerful features and intuitive user interface for the same.
 Event-driven Process Chain Diagrams
Event-driven Process Chain (EPC) Diagram is a type of flowchart widely used for modeling in business engineering and reengineering, business process improvement, and analysis. EPC method was developed within the Architecture of Integrated Information Systems (ARIS) framework.
Flowchart Example: Flow Chart of Marketing Analysis
An example flowchart of marketing analysis shows main steps you have to challenge writing a marketing analysis.Marketing Analysis Diagram
An example of marketing analysis diagram, can be used to analyse product market and define marketing strategy. This types of charts used by small business project management for making presentations on market shares, it used by marketing project management software and project management tracking tools for reporting results and statuses.Bar Diagrams for Problem Solving. Create business management bar charts with Bar Graphs Solution
Create bar charts for business management problem solving and data comparison using the ConceptDraw PRO diagramming and vector drawing software extended with the Bar Graphs Solution from the Graphs and Charts area of ConceptDraw Solition Park.
 AWS Architecture Diagrams
AWS Architecture Diagrams with powerful drawing tools and numerous predesigned Amazon icons and AWS simple icons is the best for creation the AWS Architecture Diagrams, describing the use of Amazon Web Services or Amazon Cloud Services, their application for development and implementation the systems running on the AWS infrastructure. The multifarious samples give you the good understanding of AWS platform, its structure, services, resources and features, wide opportunities, advantages and benefits from their use; solution’s templates are essential and helpful when designing, description and implementing the AWS infrastructure-based systems. Use them in technical documentation, advertising and marketing materials, in specifications, presentation slides, whitepapers, datasheets, posters, etc.
 IDEF0 Diagrams
IDEF0 Diagrams visualize system models using the Integration Definition for Function Modeling (IDEF) methodology. Use them for analysis, development and integration of information and software systems, and business process modelling.
Comparing ConceptDraw PRO to Omnigraffle
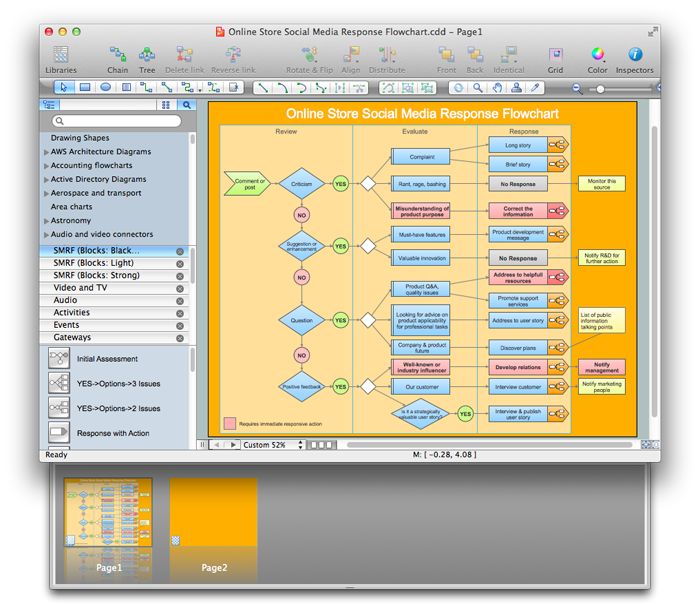
Comparing ConceptDraw PRO to Omnigraffle you can see a lot of benefits of ConceptDraw products. First the main, ConceptDraw applications are cross-platform and available in two independent and concurrent versions for Macintosh (OS X) and PC (Windows). ConceptDraw gives you the per named license, that you can use simultaneously for your both Macintosh and PC, at work and at home. Free access to the ConceptDraw Solution Park offers you great number of solutions with hundreds of templates and samples, and thousands of ready-to-use vector objects for quick and easy creation diagrams, drawings, illustrations and Mind Maps. Besides, thanks to the Ingyre Technology is provided the integration with Microsoft Office applications and capabilities of limitless exchange the information. The ConceptDraw Live Objects technology lets you design the visual dynamically-updated dashboards, the Rapid Draw technology allows create the diagrams in minutes. The extensive presentation capabilities help you create lush and beautiful presentation slideshows from your ConceptDraw documents.How to Present a Social Media Response Plan DFD to Your Team
Interactive tool helps you find the appropriate response to social media mentions quickly. There are materials to help trainers and consultants develop a social media strategy and provide training for social media groups on how to effectively accomplish their daily work.Flow Chart Symbols
The Flowcharts are incredibly useful and popular tool used in science, business, software development, analytics, engineering, marketing, manufacturing, administration, architecture, government, politics, and many other fields thanks to a variety of existing types of flowcharts. A Flowchart is a visual graphical representation of the process, algorithm, or the set of steps taken for problem's solution. Widely used for designing, visualizing and documenting simple and complex processes and programs, they effectively help to understand the process and to find easier the flaws if they are. Each flowchart type supposes the use of its own set of notations for drawing corresponding diagram, which includes the symbols of process, decision, data, document, data base, termination, initiation processes, processing loops, conditions, etc. It is easily design a Flowchart using the special professional flowchart maker - ConceptDraw PRO diagram software with numerous predesigned flow chart symbols grouped in libraries of Flowcharts solution from ConceptDraw Solution Park.Samples of Flowchart
This sample shows the Flowchart of the testing the work of the lamp and decision making about what to do to lamp will work.Introductory Guide to Rapid UML Solution
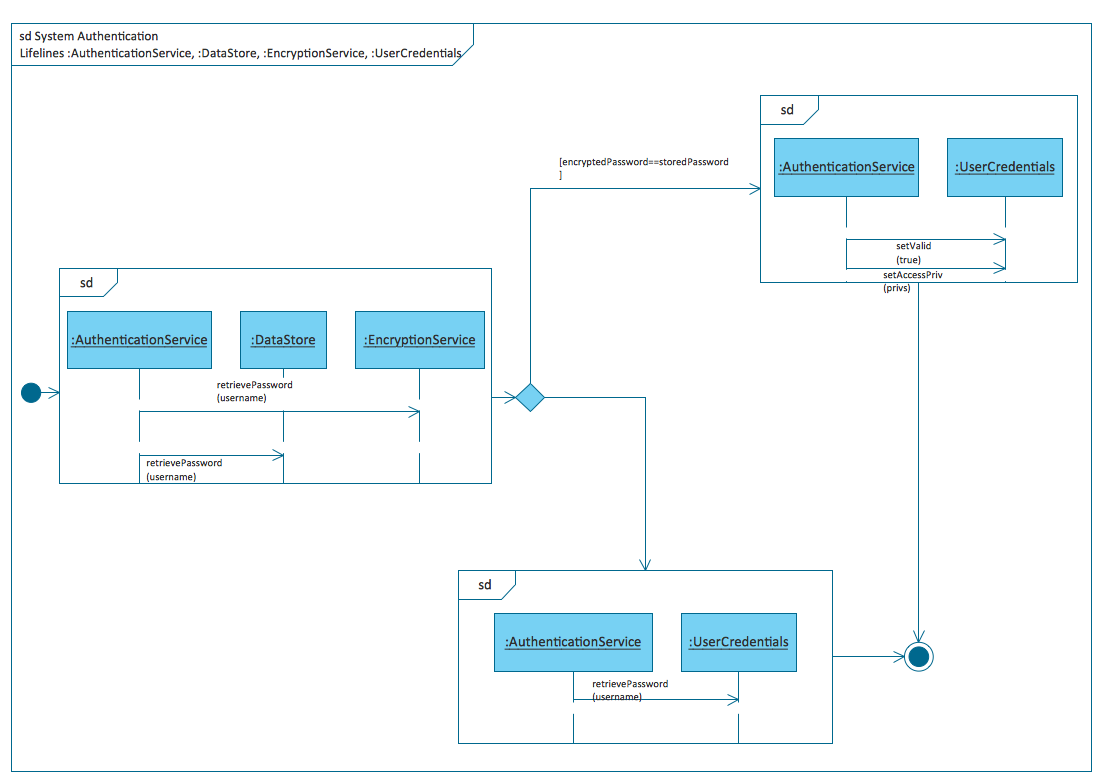
The ability to develop UML diagrams as quickly as the ideas come. The solution uses ConceptDraw RapidDraw techniques. The result is a vector graphic document.- Flowchart Of Integrated Marketing Communication
- Marketing Communications Process Flow Chart
- Marketing Communication Process Flow
- Flowchart Marketing Process . Flowchart Examples | Marketing ...
- HR Flowcharts | Market Integration Flow Charts
- What Is Marketing Communication Process With Diagrams
- Social Marketing Communication Analyse
- Diagrmatically Represent Integreated Marketing Communication
- Basic Flowchart Symbols and Meaning | HR Flowcharts | How to ...
- Flowchart Marketing Process . Flowchart Examples | Process ...
- Flowchart Marketing Process . Flowchart Examples | How to Draw a ...
- Diagrams Of Models Of Marketing Communication
- Media Scheduling With Diagram Marketing Communications
- Process Flowchart | Diagramming Software for Design UML ...
- Flowchart Of Communication Process
- Diagram For Integrated Resource Management
- Charts On Communication Process
- Communication Process Diagram Explanation
- Process Flowchart | Technical Flow Chart | Basic Flowchart Symbols ...
- Pyramid Diagram | Pyramid Diagram | Process Flowchart | Chart Of ...


