Spatial infographics Design Elements: Location Map

Excellent Examples of Infographic Maps

Spatial infographics Design Elements: Transport Map

How to draw Metro Map style infographics? Moscow, New York, Los Angeles, London

Sales Process Flowcharts

How to Draw Pictorial Chart. How to Use Infograms

Workflow Flowchart Symbols

HelpDesk
How to Add Data-driven Infographics to a MS Word Document Using ConceptDraw PRO

How tо Represent Information Graphically

Sample Pictorial Chart. Sample Infographics
")
HelpDesk
How to Create Education Infographics

 ConceptDraw Solution Park
ConceptDraw Solution Park collects graphic extensions, examples and learning materials
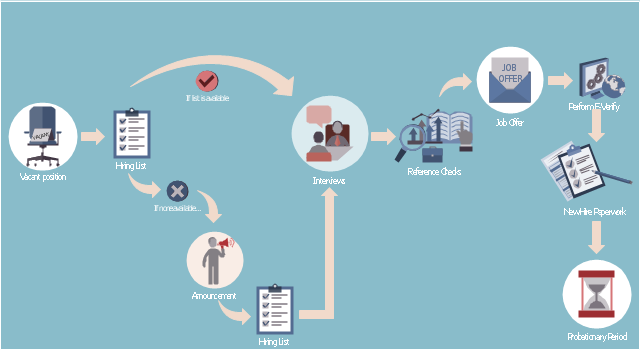
This HR infographics example was designed on the base of flowchart "Hiring Process" from the website of the Idaho Division of Human Resources.
"... hiring process flowchart outlining the steps to fill a vacant position." [dhr.idaho.gov/ hiringprocess.html]
"What is a hiring list and what are they for?
A hiring list consists of applicants who completed and passed the examination for a vacant classified position.
The applicants are ranked on the hiring list in order from highest to lowest score." [dhr.idaho.gov/ PDF%20 documents/ Flowchart/ Hiring%20 List%20 Guidance.pdf]
"Announcements.
Announcing a vacant position benefits the agency by allowing a wide array of applicants the opportunity to compete for job openings, resulting in a more qualified employee. The State Merit System requires all appointments, promotions and separations in the classified service to be based on competence, valid job requirements, and individual performance." [dhr.idaho.gov/ PDF%20 documents/ Flowchart/ Announcement.pdf]
"Conducting A Lawful Employment Interview.
Interviewing prospective employees is one of the most important activities employers do. The employer’s objective of an interview is to determine whether an applicant is suitable for an available position. The interview provides the employer an opportunity to obtain in-depth information about a job applicant’s skills, work history, and employment background for this purpose." [dhr.idaho.gov/ PDF%20 documents/ Flowchart/ Conducting%20 a%20 Lawful%20 Employment%20 Interview.pdf]
"Reference Checks.
References should be checked after a successful interview with a candidate, but before you offer them the position. If after interviewing there are several candidates that are qualified for the position, reference checks are also a way to further distinguish who might best fit within your agency." [dhr.idaho.gov/ PDF%20 documents/ Flowchart/ Reference%20 Checks.pdf]
"Making the job offer.
Before offering the position to your selected candidate, be sure to speak with your HR and fiscal staff. They may have some suggestions for negotiating the starting salary, etc.
Job Offer Letter.
... A job offer letter should be given to the newly hired employee after you have verbally negotiated the terms of employment. This letter confirms the conditions of employment the selected candidate has accepted and gives them information for their first day." [dhr.idaho.gov/ PDF%20 documents/ Flowchart/ Making%20 the%20 job%20 offer.pdf]
"E-verify.
To ensure compliance with the Governor’s Executive Order 2009-10, all
State Agencies are encouraged to participate in E-verify.
E-verify is an internet based system that allows an employer, using information reported on an employee’s Form I-9, to determine the eligibility of that employee to work in the United States.
The E-Verify system is operated by the U.S. Department of Homeland Security in partnership with the Social Security Administration and its use is free of charge to employers." [dhr.idaho.gov/ PDF%20 documents/ Flowchart/ EVerify%20 Statement.pdf]
"New Hire Paperwork.
There are several important forms for the new employee to fill out." [dhr.idaho.gov/ PDF%20 documents/ Flowchart/ New%20 Hire%20 Paperwork.pdf]
"Probationary Period.
All appointments and promotions into classified positions require a probationary period of 1,040 hours
except for peace officers who must serve 2,080 hours.
The probationary period is a working test period to evaluate the work performance of the employee and to determine their suitability for the position." [dhr.idaho.gov/ PDF%20 documents/ Flowchart/ Probationary%20 Period%20 for%20 Hiring%20 Process.pdf]
The HR infographics example "Hiring process workflow" was created using the ConceptDraw PRO diagramming and vector drawing software extended with the HR Flowcharts solution from the Management area of ConceptDraw Solution Park.
HR infographics
HelpDesk
How to Create Management Infographics Using ConceptDraw PRO

HelpDesk
How to Create PowerPoint Presentation from Data Driven Infographics Using ConceptDraw PRO

- Construction Project Chart Examples | Process Flowchart | Best Tool ...
- Process Flowchart | After Effects Circular Arrows Chart Infographic
- Marketing Plan Infographic | Flowchart Marketing Process . Flowchart ...
- Best Tool for Infographic Construction | Process Flowchart | How Do ...
- How to Create Education Infographics | Basic Flowchart Symbols ...
- Process Flowchart | Spatial infographics Design Elements: Location ...
- Import process - Flowchart | Marketing Infographics | Flow Chart Of ...
- Spatial infographics Design Elements: Location Map | Process ...
- Process Flowchart | Typography Infographic Software | Make an ...
- Map of Germany | Subway infographic design elements - software ...
- Marketing Infographics | Process Flowchart | Venn Diagram ...
- Construction Project Chart Examples | Best Tool for Infographic ...
- Process Flowchart | How to Create a Powerful Infographic When ...
- Process Flowchart | Content Marketing Infographics | Photo For E ...
- Excellent Examples of Infographic Maps | Process Flowchart | Map ...
- Process Flowchart | Cross-Functional Flowchart | Infographic ...
- Spatial Infographics | Spatial Data Analysis | Process Flowchart ...
- Process Flowchart | Spatial Infographics | Dfd Tour
- Infographic Generator | Project Timeline | Process Flowchart ...
- Process Flowchart | Infographic Maker | How to Draw an ...