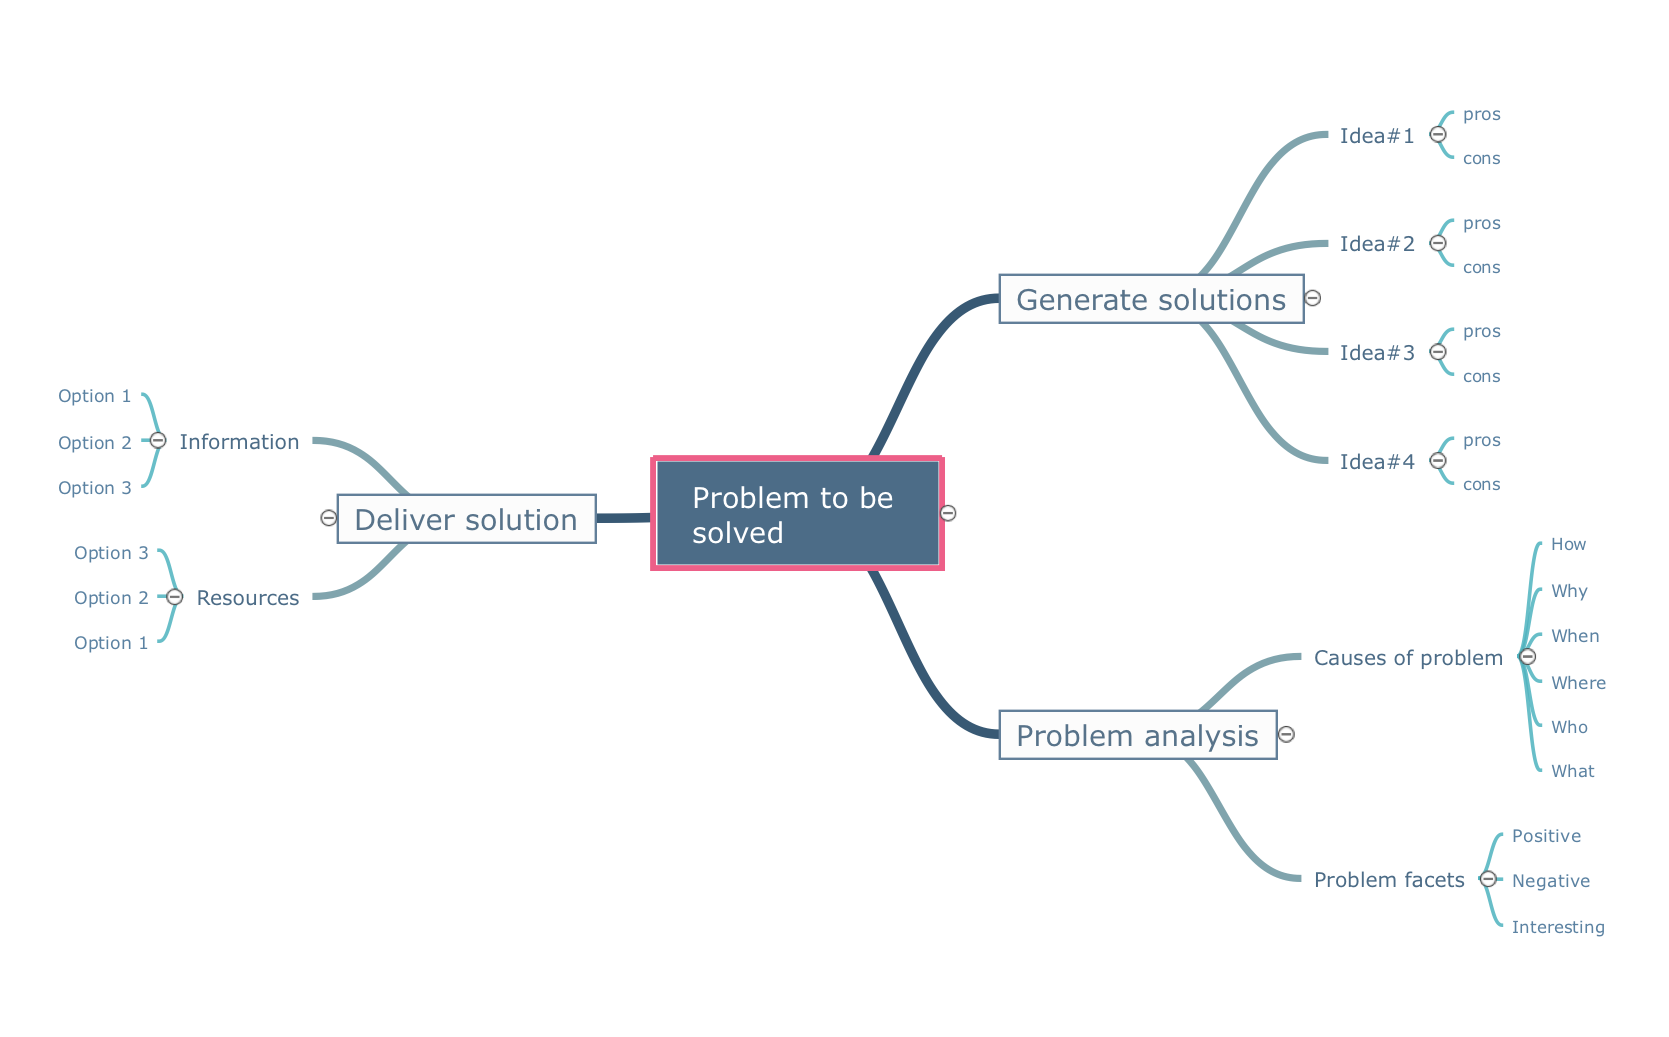
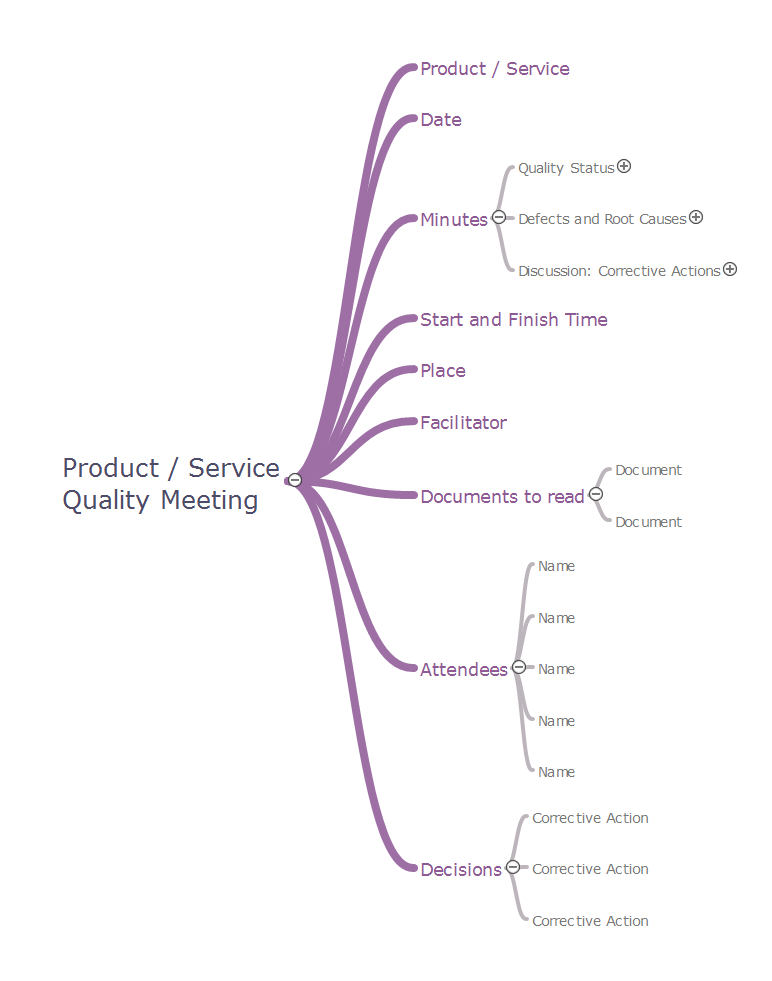
Venn Diagram Examples for Problem Solving
In the Venn Diagrams solution, there are the pre-made examples that can be always used for making the unique, great looking diagrams, such as the 2-set Venn ones of any needed colour, the 3-set one, the 4-set ones and the 5-set ones. Having the already previously created samples of the Venn diagrams can help any ConceptDraw DIAGRAM user make it possible to make the needed drawing within only a few minutes by editing the existing ones.Problem solving
Problem Solving - ConceptDraw OFFICT suite is a software for the problem solving. The Seven Management and Planning Tools solution is a set of such tools for investigating complex problems.These tools are exemplary at organizing research, parsing complex problems, providing a structure for the details, helping managers make decisions, and organizing effective communications in a visual manner that keeps everyone involved.
Fishbone Diagram Problem Solving
The Ishikawa diagram, Cause and Effect diagram, Fishbone diagram — all they are the names of one and the same visual method for working with causal connections. Originally invented by Kaoru Ishikawa to control the process quality, the Ishikawa diagram is well proven in other fields of management and personal scheduling, events planning, time management. It is a chart in the form of a fish, whose head is a problem, the fins are variants for its causes.To design easily the Fishbone diagram, you can use a special ConceptDraw DIAGRAM vector graphic and diagramming software which contains the powerful tools for Fishbone diagram problem solving offered by Fishbone Diagrams solution for the Management area of ConceptDraw Solution Park.
How Do Fishbone Diagrams Solve Manufacturing Problems
How do Fishbone diagrams solve manufacturing problems? Fishbone diagrams are successfully used in various fields of industries and manufacturing to analyze the set of possible causes and their effects. Fishbone diagram provides a process to clearly define the “Effect” and then puts you to thinking about the possible causes, based on the categories of common problems in manufacturing.ConceptDraw DIAGRAM application extended with Fishbone Diagrams solution lets you construct Fishbone diagrams and represent globally recognized standards for manufacturing 6 Ms and 8 Ms.
8 Step Problem Solving
This mind map shows 8 steps approach to solving any kind of product or service problems.Quality Project Management with Mind Maps
The visual form of mind maps is helpful in all stages of quality management, from describing problem to describing and documenting a decision.Quality meeting
With this mind map template, you can quickly prepare for quality meetings by filling in the appropriate fields. By using this mind map to take notes during the meeting, you'll be able to send a one-page summary to meeting participants or use later to present the material, yourself, to a different audience.What is a Quality Management
Successful quality management implemented in a company of any size is a critical component of a company organization.A Creative Look at Quality Procedures
Get a creative look at a quality procedures with mindmaping software ConceptDraw MINDMAP. Mind maps can be of great value in depicting and describing a problem in detail, then structure it, and find the right decision.Flowchart Components
The ConceptDraw Flowchart component includes a set of samples and templates. This geathered as flowchart maker toolbox which focused on drawing flowcharts of any industry standards.- Flowchart Diagram For Solving A Given Problem
- Examples Of Flowcharts Designed To Solve Mathematical Problems
- Fishbone Diagram Problem Solving | Human Resource ...
- Network Diagram Problems With Solutions
- Bar Diagrams for Problem Solving . Create event management bar ...
- Fishbone Diagram Problem Solving | Using Fishbone Diagrams for ...
- Fishbone Diagram Example | How Do Fishbone Diagrams Solve ...
- Quality Mind Map | Quality Problems Examples
- Physics Math Symbol Name List
- Fishbone Diagram Example For Computer Not Working
- ERD | Entity Relationship Diagrams, ERD Software for Mac and Win
- Flowchart | Basic Flowchart Symbols and Meaning
- Flowchart | Flowchart Design - Symbols, Shapes, Stencils and Icons
- Flowchart | Flow Chart Symbols
- Electrical | Electrical Drawing - Wiring and Circuits Schematics
- Flowchart | Common Flowchart Symbols