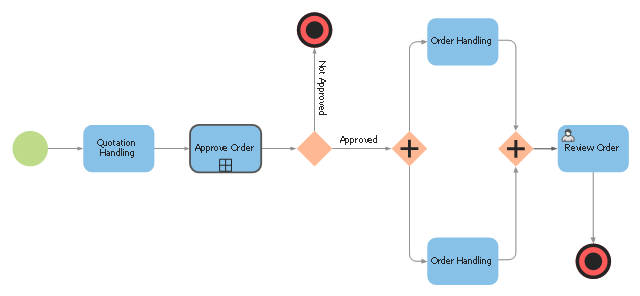
"In business or commerce, an order is a stated intention, either spoken or written, to engage in a commercial transaction for specific products or services. From a buyer's point of view it expresses the intention to buy and is called a purchase order. From a seller's point of view it expresses the intention to sell and is referred to as a sales order. When the purchase order of the buyer and the sales order of the seller agree, the orders become a contract between the buyer and seller.
Within an organization, the term order may be used to refer to a work order for manufacturing, a preventive maintenance order, or an order to make repairs to a facility.
In many businesses, orders are used to collect and report costs and revenues according to well-defined purposes. Then it is possible to show for what purposes costs have been incurred." [Order (business). Wikipedia]
The BPMN 2.0 (Business Process Model and Notation) diagram example "Order process" was created using the ConceptDraw PRO diagramming and vector drawing software extended with the Business Process Diagram solution from the Business Processes area of ConceptDraw Solution Park.
BPMN 2.0 diagram
Preventive Action
 - Minimization-of-material-wastage")

Decision Making

Chore charts with ConceptDraw PRO

PDPC

Bubble Charts

CORRECTIVE ACTIONS PLANNING. Risk Diagram (PDPC)
 - Health care")
 Seven Management and Planning Tools
Seven Management and Planning Tools solution extends ConceptDraw PRO and ConceptDraw MINDMAP with features, templates, samples and libraries of vector stencils for drawing management mind maps and diagrams.
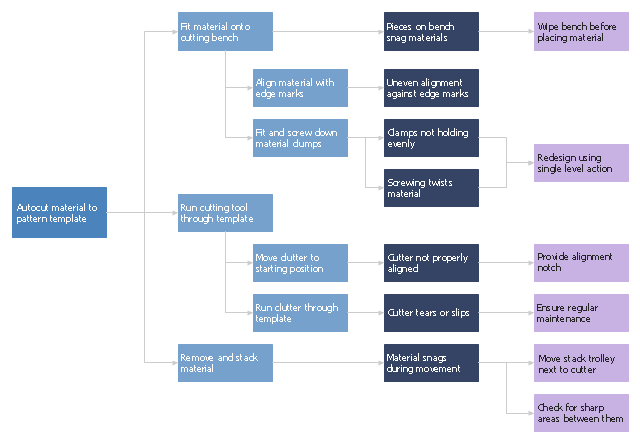
"Waste minimization is the process and the policy of reducing the amount of waste produced by a person or a society.
Waste minimization involves efforts to minimize resource and energy use during manufacture. For the same commercial output, usually the fewer materials are used, the less waste is produced. Waste minimization usually requires knowledge of the production process, cradle-to-grave analysis (the tracking of materials from their extraction to their return to earth) and detailed knowledge of the composition of the waste. ...
In the waste hierarchy, the most effective approaches to managing waste are at the top. In contrast to waste minimisation, waste management focuses on processing waste after it is created, concentrating on re-use, recycling, and waste-to-energy conversion." [Waste minimisation. Wikipedia]
The process decision program chart (PDPC) example "Minimization of material wastage" was created using the ConceptDraw PRO diagramming and vector drawing software extended with the solution "Seven Management and Planning Tools" from the Management area of ConceptDraw Solution Park.
PDPC
CORRECTIVE ACTIONS PLANNING. Involvement Matrix

PROBLEM ANALYSIS. Prioritization Matrix

Authority Matrix Diagram Software

Affinity Diagram

- Preventive Maintenance Block Diagram
- Total Preventive Maintenance Block Diagram
- Block Diagram Of Maintenance Management
- Block Diagram Of Maintenance
- Server Maintenance Basic Diagram
- Block Diagram Of Maintenance Planning
- Work Order Process Flowchart. Business Process Mapping ...
- Order process - BPMN 2.0 diagram | Taxi service order procedure ...
- Maintenance Work Order Process Flow Chart
- Diagram For Maintenance Management
- Order process - BPMN 2.0 diagram | Basic Flowchart Symbols and ...
- Basic Flowchart Symbols and Meaning | Order process - BPMN 2.0 ...
- Order process - BPMN 2.0 diagram | Business Process Diagrams ...
- Order process - BPMN 2.0 diagram | Swim Lane Flowchart Symbols ...
- BPMN 2.0 | BPMN | Order process - BPMN 2.0 diagram | Wikipedia ...
- Sales Process Flowchart Symbols
- Diagram Of Tools In Maintenance
- Event-driven Process Chain Diagrams | ATM UML Diagrams | Order ...
- Replacement Maintenance Planning Block Diagram
- How well does Your Purchase Process Flow? | Order process ...