Line Graph

How to Draw a Line Graph

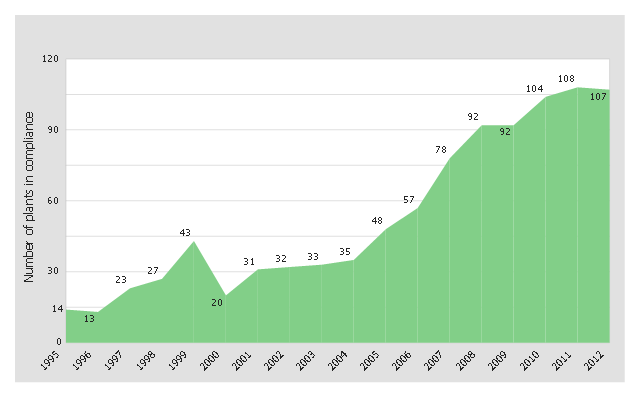
This area chart sample was redesigned from the picture "Outstanding trends of wastewater treatment plants" from the Washington State Department of Ecology website.
[ecy.wa.gov/ programs/ wq/ wastewater/ op_ cert/ kudos.html]
"Sewage treatment is the process of removing contaminants from wastewater and household sewage, both runoff (effluents), domestic, commercial and institutional. It includes physical, chemical, and biological processes to remove physical, chemical and biological contaminants. Its objective is to produce an environmentally safe fluid waste stream (or treated effluent) and a solid waste (or treated sludge) suitable for disposal or reuse (usually as farm fertilizer). Using advanced technology it is now possible to re-use sewage effluent for drinking water, although Singapore is the only country to implement such technology on a production scale in its production of NEWater." [Sewage treatment. Wikipedia]
The area graph example "Outstanding trends of wastewater treatment plants" was created using the ConceptDraw PRO diagramming and vector drawing software extended with the Area Charts solution from the Graphs and Charts area of ConceptDraw Solution Park.
Area chart
Bar Diagrams for Problem Solving. Create manufacturing and economics bar charts with Bar Graphs Solution

Line Chart

Line Chart Templates

Line Chart Examples

Chart Maker for Presentations

 Line Graphs
How to draw a Line Graph with ease? The Line Graphs solution extends the capabilities of ConceptDraw PRO v10 with professionally designed templates, samples, and a library of vector stencils for drawing perfect Line Graphs.
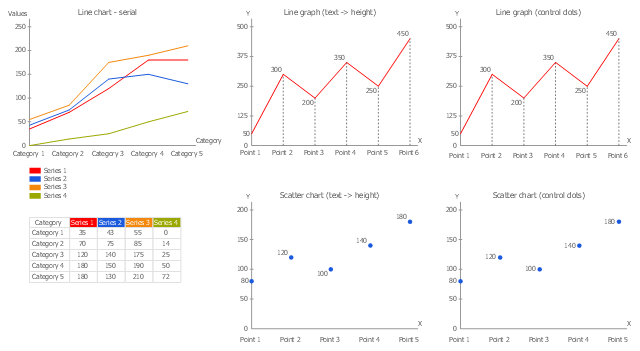
"A line chart or line graph is a type of chart which displays information as a series of data points connected by straight line segments. It is a basic type of chart common in many fields. It is similar to a scatter plot except that the measurement points are ordered (typically by their x-axis value) and joined with straight line segments. A line chart is often used to visualize a trend in data over intervals of time – a time series – thus the line is often drawn chronologically." [Line chart. Wikipedia]
The templates example "Design elements - Line graphs" was drawn using the ConceptDraw PRO diagramming and vector drawing software extended with the Line Graphs solution from the Graphs and Charts area of ConceptDraw Solution Park.
The templates example "Design elements - Line graphs" was drawn using the ConceptDraw PRO diagramming and vector drawing software extended with the Line Graphs solution from the Graphs and Charts area of ConceptDraw Solution Park.
Templates
Line Chart Template for Word

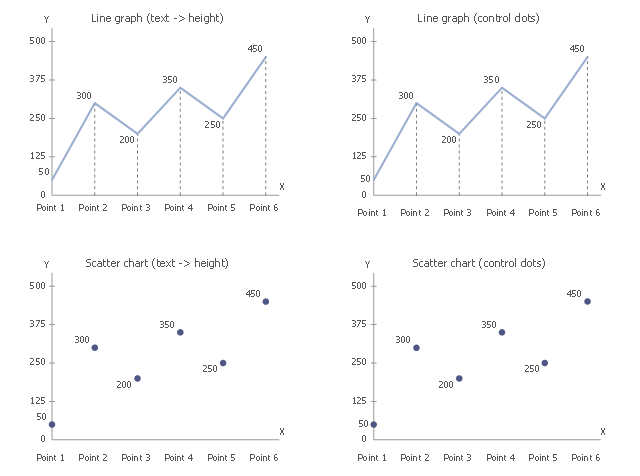
The vector stencils library "Line Graphs" contains 4 chart templates. Use it to design your line charts in ConceptDraw PRO diagramming and vector drawing software.
"A line chart or line graph is a type of chart which displays information as a series of data points connected by straight line segments. It is a basic type of chart common in many fields. It is similar to a scatter plot except that the measurement points are ordered (typically by their x-axis value) and joined with straight line segments. A line chart is often used to visualize a trend in data over intervals of time – a time series – thus the line is often drawn chronologically." [Line chart. Wikipedia]
The templates example "Design elements - Line graphs" is included in the Basic Line Graphs solution from the Graphs and Charts area of ConceptDraw Solution Park.
Chart templates
What Is a Line Chart

Line Charts

This pictorial chart sample shows the population growth by continent in 2010-2013.
"Population growth' refers to the growth in human populations. Global population growth is around 80 million annually, or 1.2% p.a. The global population has grown from 1 billion in 1800 to 7 billion in 2012. It is expected to keep growing to reach 11 billion by the end of the century. Most of the growth occurs in the nations with the most poverty, showing the direct link between high population growth and low standards of living. The nations with high standards of living generally have low or zero rates of population growth. Australia's population growth is around 400,000 annually, or 1.8% p.a., which is nearly double the global average. It is caused mainly by very high immigration of around 200,000 p.a., the highest immigration rate in the world. Australia remains the only nation in the world with both high population growth and high standards of living." [Population growth. Wikipedia]
The image chart example "Population growth by continent, 2010 - 2013" was created using the ConceptDraw PRO diagramming and vector drawing software extended with the Basic Picture Graphs solution from the Graphs and Charts area of ConceptDraw Solution Park.
Image chart

- Trend Graph Icon
- Graph Showing Current Trends In Business Industry
- Current Trends In The Industry Of Business Management Graph
- Human Resource Current Trends With Graph Or Diagram
- Dashboard | Graph For Current Trends In The Industry
- Dashboard | USA Maps | Graph That Illustrates The Current Trends ...
- Trend In Column Graph
- Example Of A Graph That Illustate The Current Trend In Pr
- Bar Graphs | Sales Growth. Bar Graphs Example | How to Draw a ...
- Serious crime in Cincinnati | Column Chart Examples | How to ...
- Outstanding trends of wastewater treatment plants | Building ...
- Picture graph - Template | Picture Graph | Chart Maker for ...
- Serious crime in Cincinnati | Column Chart Examples | Bar Graphs ...
- Column Graph
- Sales Growth. Bar Graphs Example | Business Report Pie. Pie Chart ...
- Outstanding trends of wastewater treatment plants | United States ...
- Chart Examples | Chart Templates | Recent Bar Graph On Crime ...
- Create Graphs and Charts | Matrix Organization Structure ...
- Graph Of Human Resources
- Sample Marketing Graph