The interior design project for any home, flat, business center includes the set of different plans and documents, among them obligatory are the ceiling plans. For creation these plans will be convenient to use professional drawing software. It is especially useful in cases when you need create and propose for customer the multiple alternative design plans for choice.
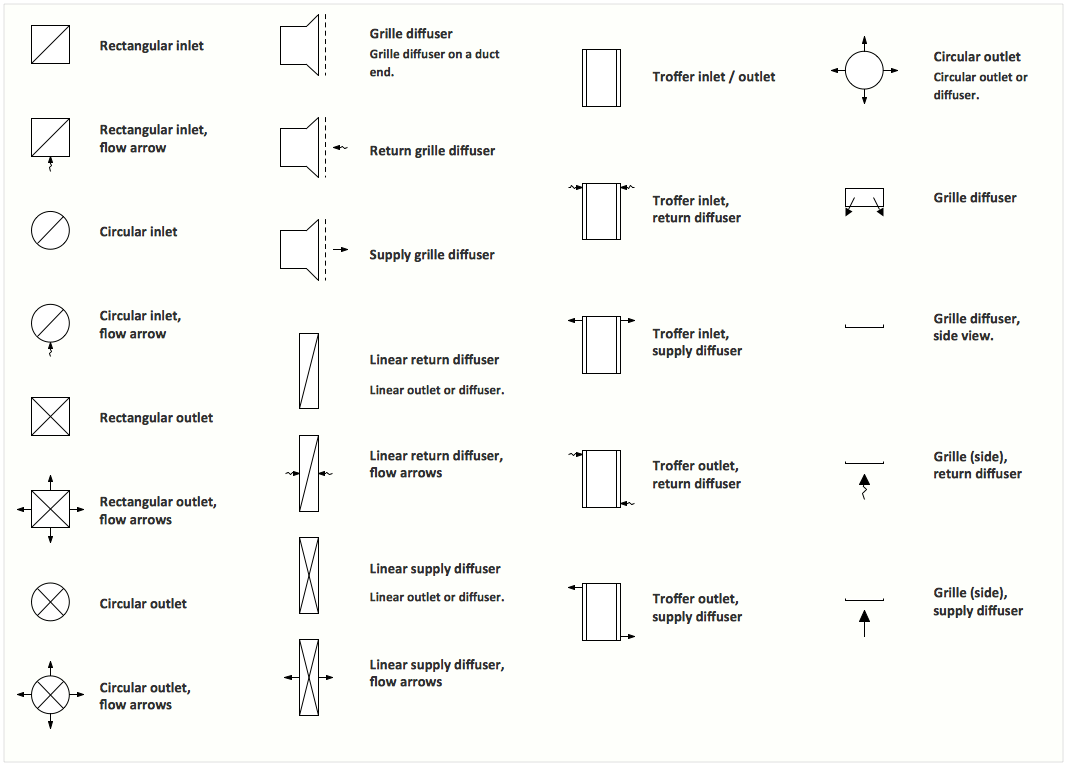
ConceptDraw DIAGRAM diagramming and vector drawing software extended with Reflected Ceiling Plan solution is the choice of architects, designers, electricians, and other building-related people. It is ideal for displaying the ceiling design ideas which meet any requirements of building and budget. Included templates, samples and especially wide selection of vector design elements, including the elements offered by Registers, Drills and Diffusers library are helpful in drawing without efforts professional-looking Reflected Ceiling plans, Reflective Ceiling plans, Lighting Plans, Electrical Plans, Plans of location the outlets, grilles, diffusers, registers, light fixtures, light panels, etc.


