This area chart sample shows the population growth of San Francisco, California from 1850-2005. It was redesigned from the Wikimedia Commons file: San Francisco CA Population Growth.svg. [commons.wikimedia.org/ wiki/ File:San_ Francisco_ CA_ Population_ Growth.svg]
"The San Francisco Bay Area, commonly known as the Bay Area, is a populated region that surrounds the San Francisco and San Pablo estuaries in Northern California, United States. The region encompasses the major cities and metropolitan areas of San Francisco, Oakland, and San Jose, along with smaller urban and rural areas. The Bay Area's nine counties are Alameda, Contra Costa, Marin, Napa, San Francisco, San Mateo, Santa Clara, Solano, and Sonoma. Home to approximately 7.44 million people, the nine-county Bay Area contains many cities, towns, airports, and associated regional, state, and national parks, connected by a network of roads, highways, railroads, bridges, tunnels and commuter rail. The combined urban area of San Francisco and San Jose is the second largest in California (after the Greater Los Angeles area), the fifth largest in the United States, and the 56th largest urban area in the world." [San Francisco Bay Area. Wikipedia]
The area graph example "San Francisco CA Population Growth" was created using the ConceptDraw PRO diagramming and vector drawing software extended with the Area Charts solution from the Graphs and Charts area of ConceptDraw Solution Park.
Area chart

Basic Diagramming


This picture bar graph sample shows regional population growth from 2010 to 2016. It was designed using data from the Wikipedia article List of continents by population.
[en.wikipedia.org/ wiki/ List_ of_ continents_ by_ population]
"Population geography is a division of human geography. It is the study of the ways in which spatial variations in the distribution, composition, migration, and growth of populations are related to the nature of places. Population geography involves demography in a geographical perspective. It focuses on the characteristics of population distributions that change in a spatial context." [Population geography. Wikipedia]
The pictorial chart example "Regional population growth from 2010 to 2016" was created using the ConceptDraw PRO diagramming and vector drawing software extended with the Picture Graphs solution from the Graphs and Charts area of ConceptDraw Solution Park.
Image chart

Pictures of Graphs

Picture Graph

Area Chart
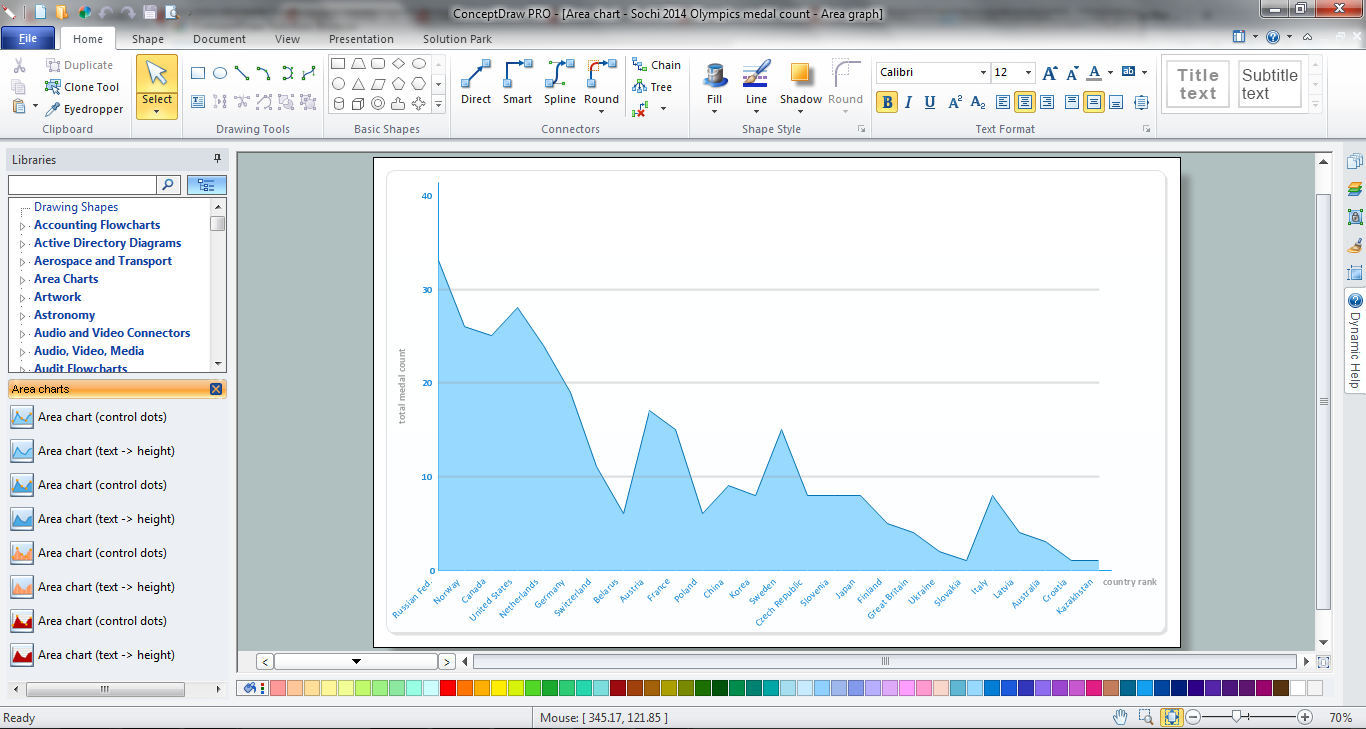
 Basic Area Charts
This solution extends the capabilities of ConceptDraw DIAGRAM (or later) with templates, samples and a library of vector stencils for drawing Area Charts (area graphs) that visualize changes in values by filling in the area beneath the line connecting data points.
Line Graph

What Is a Line Chart

Geo Map — Asia

 Picture Graphs
Typically, a Picture Graph has very broad usage. They many times used successfully in marketing, management, and manufacturing. The Picture Graphs Solution extends the capabilities of ConceptDraw DIAGRAM with templates, samples, and a library of professionally developed vector stencils for designing Picture Graphs.
Visual Presentations Made Easy with Diagramming Software

How To use House Electrical Plan Software


Bar Graph

Seven Basic Tools of Quality — Quality Control

- Solution For Population Explosion In Drawing
- Population Explosion Drawing Img
- Population Explosion Flow Chart
- Population growth by continent | Geo Map - Africa - Madagascar ...
- San Francisco CA population growth | Rolla USGS Center locator ...
- What Is Population Explosion With The Help Of Graph
- Population Growth Flow Diagram
- Population Explosion Bar Chart
- San Francisco CA population growth | Population growth by ...
- Flow Population Explosion
- Population Chart Drawing
- Line Chart Examples | Regional population growth from 2010 to ...
- Population growth by continent | Geo Map - Asia | Geo Map - South ...
- Population Growth Clipart
- Regional population growth from 2010 to 2016 | Picture Graph ...
- Graph Representing Population Growth Of Various Continents
- World Population Growth Per Continent
- An Easy Diagram Of Population
- Process Of Population Growth Pie Chart
- Line Chart Examples | Regional population growth from 2010 to ...