Basic Diagramming


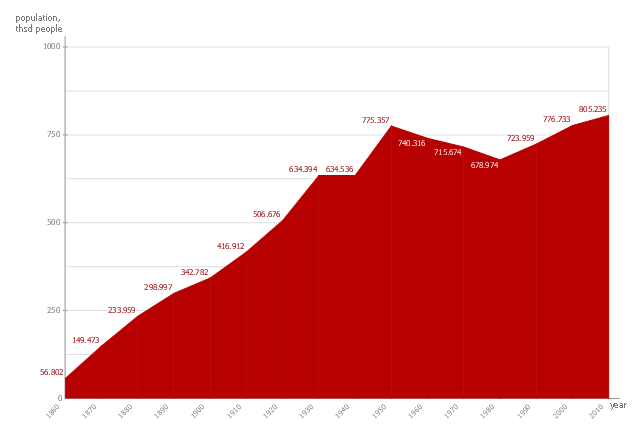
This area chart sample shows the San Francisco population changes from 1860 to 2010.
"San Francisco ..., officially the City and County of San Francisco, is the leading financial and cultural center of Northern California and the San Francisco Bay Area.
The only consolidated city-county in California, San Francisco encompasses a land area of about 46.9 square miles (121 km2) on the northern end of the San Francisco Peninsula, giving it a density of about 17,620 people per square mile (6,803 people per km2). It is the most densely settled large city (population greater than 200,000) in the state of California and the second-most densely populated major city in the United States after New York City. San Francisco is the fourth most populous city in California, after Los Angeles, San Diego and San Jose, and the 14th most populous city in the United States—with a Census-estimated 2012 population of 825,863. The city is also the financial and cultural hub of the larger San Jose-San Francisco-Oakland metropolitan area, with a population of 8.4 million." [San Francisco. Wikipedia]
The area graph example "San Francisco population history" was created using the ConceptDraw PRO diagramming and vector drawing software extended with the Area Charts solution from the Graphs and Charts area of ConceptDraw Solution Park.
Area chart
Line Chart Examples

Line Graph

This picture bar graph sample shows regional population growth from 2010 to 2016. It was designed using data from the Wikipedia article List of continents by population.
[en.wikipedia.org/ wiki/ List_ of_ continents_ by_ population]
"Population geography is a division of human geography. It is the study of the ways in which spatial variations in the distribution, composition, migration, and growth of populations are related to the nature of places. Population geography involves demography in a geographical perspective. It focuses on the characteristics of population distributions that change in a spatial context." [Population geography. Wikipedia]
The pictorial chart example "Regional population growth from 2010 to 2016" was created using the ConceptDraw PRO diagramming and vector drawing software extended with the Picture Graphs solution from the Graphs and Charts area of ConceptDraw Solution Park.
Image chart

Pictures of Graphs

This area chart sample shows the population growth of San Francisco, California from 1850-2005. It was redesigned from the Wikimedia Commons file: San Francisco CA Population Growth.svg. [commons.wikimedia.org/ wiki/ File:San_ Francisco_ CA_ Population_ Growth.svg]
"The San Francisco Bay Area, commonly known as the Bay Area, is a populated region that surrounds the San Francisco and San Pablo estuaries in Northern California, United States. The region encompasses the major cities and metropolitan areas of San Francisco, Oakland, and San Jose, along with smaller urban and rural areas. The Bay Area's nine counties are Alameda, Contra Costa, Marin, Napa, San Francisco, San Mateo, Santa Clara, Solano, and Sonoma. Home to approximately 7.44 million people, the nine-county Bay Area contains many cities, towns, airports, and associated regional, state, and national parks, connected by a network of roads, highways, railroads, bridges, tunnels and commuter rail. The combined urban area of San Francisco and San Jose is the second largest in California (after the Greater Los Angeles area), the fifth largest in the United States, and the 56th largest urban area in the world." [San Francisco Bay Area. Wikipedia]
The area graph example "San Francisco CA Population Growth" was created using the ConceptDraw PRO diagramming and vector drawing software extended with the Area Charts solution from the Graphs and Charts area of ConceptDraw Solution Park.
Area chart

 Picture Graphs
Typically, a Picture Graph has very broad usage. They many times used successfully in marketing, management, and manufacturing. The Picture Graphs Solution extends the capabilities of ConceptDraw PRO v10 with templates, samples, and a library of professionally developed vector stencils for designing Picture Graphs.
Picture Graph

Area Chart

What Is a Line Chart

Chart Examples

 Basic Area Charts
This solution extends the capabilities of ConceptDraw PRO v10.3.0 (or later) with templates, samples and a library of vector stencils for drawing Area Charts (area graphs) that visualize changes in values by filling in the area beneath the line connecting data points.
This area chart sample shows the San Francisco population changes from 1860 to 2010.
"San Francisco ..., officially the City and County of San Francisco, is the leading financial and cultural center of Northern California and the San Francisco Bay Area.
The only consolidated city-county in California, San Francisco encompasses a land area of about 46.9 square miles (121 km2) on the northern end of the San Francisco Peninsula, giving it a density of about 17,620 people per square mile (6,803 people per km2). It is the most densely settled large city (population greater than 200,000) in the state of California and the second-most densely populated major city in the United States after New York City. San Francisco is the fourth most populous city in California, after Los Angeles, San Diego and San Jose, and the 14th most populous city in the United States—with a Census-estimated 2012 population of 825,863. The city is also the financial and cultural hub of the larger San Jose-San Francisco-Oakland metropolitan area, with a population of 8.4 million." [San Francisco. Wikipedia]
The area graph example "San Francisco population history" was created using the ConceptDraw PRO diagramming and vector drawing software extended with the Area Charts solution from the Graphs and Charts area of ConceptDraw Solution Park.
"San Francisco ..., officially the City and County of San Francisco, is the leading financial and cultural center of Northern California and the San Francisco Bay Area.
The only consolidated city-county in California, San Francisco encompasses a land area of about 46.9 square miles (121 km2) on the northern end of the San Francisco Peninsula, giving it a density of about 17,620 people per square mile (6,803 people per km2). It is the most densely settled large city (population greater than 200,000) in the state of California and the second-most densely populated major city in the United States after New York City. San Francisco is the fourth most populous city in California, after Los Angeles, San Diego and San Jose, and the 14th most populous city in the United States—with a Census-estimated 2012 population of 825,863. The city is also the financial and cultural hub of the larger San Jose-San Francisco-Oakland metropolitan area, with a population of 8.4 million." [San Francisco. Wikipedia]
The area graph example "San Francisco population history" was created using the ConceptDraw PRO diagramming and vector drawing software extended with the Area Charts solution from the Graphs and Charts area of ConceptDraw Solution Park.
Area chart
Chart Templates

- Bar Graph Of Population Growth Rate
- Line Graph Of Population
- Design elements - Picture bar graphs | Barrie population - Picture ...
- Line Chart Examples | Pictures of Graphs | Types of Flowchart ...
- Basic Diagramming | Area Chart | Pictures of Graphs | Population ...
- Pictures of Graphs | Regional population growth from 2010 to 2016 ...
- Picture Graph
- Evolution of the population | Examples Of Divergence Line Graph
- Chart Templates | Picture Graphs Solution. ConceptDraw.com ...
- Step Area Graph | US incarceration timeline-clean - Area graph | US ...
- Population Chart Drawing
- Line Chart Examples | Regional population growth from 2010 to ...
- Barrie population - Picture bar graph | Pictures of Graphs | Sales ...
- Diagram On Population Data Using A Graph
- Barrie population - Picture bar graph | Basic Diagramming | Line ...
- Population growth by continent | Geo Map - Africa - Madagascar ...
- Barrie population - Picture bar graph | Pictures of Graphs | Picture ...
- Basic Diagramming | Line Graph | Bar Graph | Scatter Plot On Us ...
- Picture Graphs | Infographic Maker | Chart Templates | Population ...
- Rainfall Bar Chart | Image chart - The total financing of the ...