This site uses cookies. By continuing to browse the ConceptDraw site you are agreeing to our Use of Site Cookies.

Pie Chart Software

A pie chart is a circular diagram showing a set of data divided into proportional slices. There are several variations of this chart such as donut chart, exploded pie chart, multi-level pie charts. Although it is not very informative when a ring chart or circle chart has many sections, so choosing a low number of data points is quite important for a useful pie chart.
ConceptDraw DIAGRAM software with Pie Charts solution helps to create pie and donut charts for effective displaying proportions in statistics, business and mass media for composition comparison, i.e. for visualization of part percentage inside one total.

Pie Donut Chart. Pie Chart Examples

This sample shows the Pie Donut Chart. It was created in ConceptDraw DIAGRAM diagramming and vector drawing software using the ready-to-use object from the Pie Charts Solution from Graphs and Charts area of ConceptDraw Solution Park.
The Pie Donut Chart visualizes the percentage of parts of the whole and looks like as a ring divided into sectors. Pie Donut Charts are widely used in the business, statistics, analytics, mass media.

Pie Chart Examples and Templates

A pie chart or a circle graph is a circular chart divided into sectors, illustrating numerical proportion. In a pie chart, the arc length of each sector and consequently its central angle and area, is proportional to the quantity it represents.

Pie chart examples and templates created using ConceptDraw DIAGRAM software helps you get closer with pie charts and find pie chart examples suite your needs.

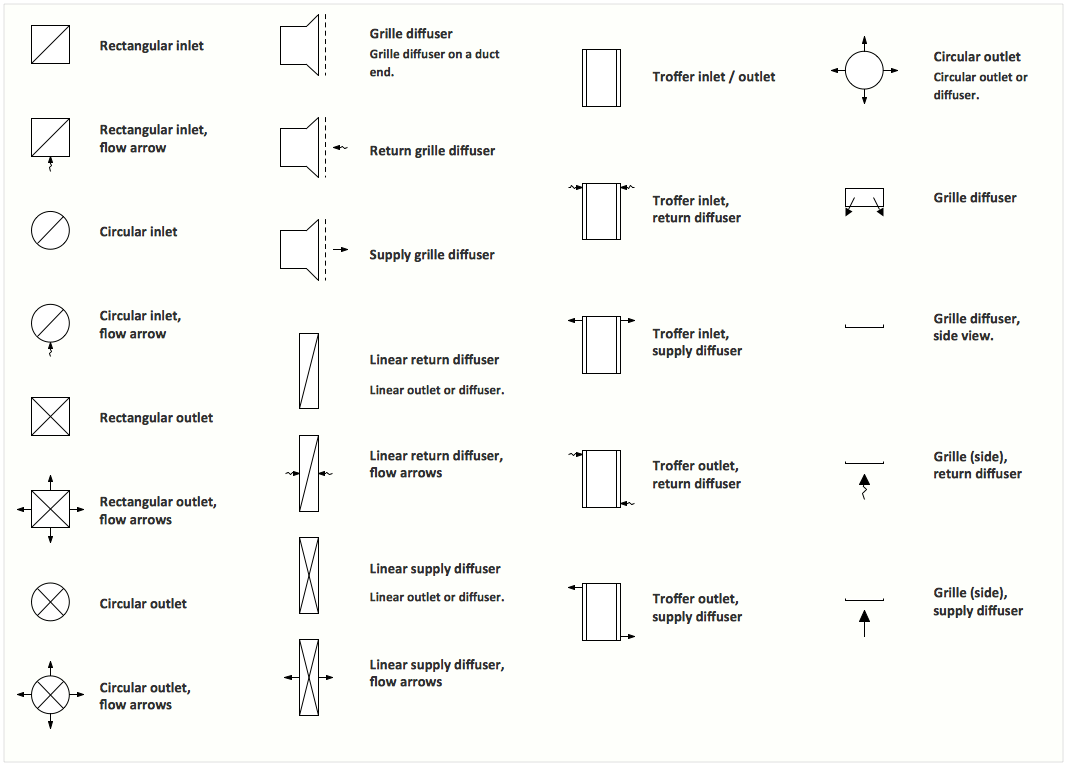
Interior Design. Registers, Drills and Diffusers — Design Elements

If you ever need to draw to create design interior using design elements, all necessary symbols can be taken from all of our numerous libraries, including Registers, Drills and Diffusers one, which contains 47 symbols.

Flow Chart Symbols

Flowcharts are used in designing and documenting simple processes or programs. Like other types of diagrams, they help visualize what is going on and thereby help understand a process, and perhaps also find flaws, bottlenecks, and other less-obvious features within it. There are many different types of flowcharts, and each type has its own repertoire of boxes and notational conventions.
Flowchart diagrams consists of symbols of process, decision, data and document, data base, termination or initiation processes, processing loops and conditions. To create an drawn flowchart use professional flowchart maker of ConceptDraw DIAGRAM.
HelpDesk

How to Draw a Pie Chart

A pie chart represents data, in a clear and easy to read around (pie) form. A circular pie chart is divided into sections (slice). Each "slice" depicts the It reflects the proportion of each component in the whole "pie". This type of chart is most often used for the visualization of statistical data. That is why pie charts are widely used in marketing. As the pie charts show proportional parts of a whole, they are good for various visual comparisons. For example, it is difficult to imagine a more intuitive way to show segmentation and market share. ConceptDraw DIAGRAM allows you to draw a simple and clear Pie Chart using the Pie Charts solution.

Basic Diagramming

Perfect charts and graphics diagramming software with rich examples and template. ConceptDraw is ideal to draw Charts and Graphics.
The vector stencils library "Circular diagrams" contains 42 templates of circular diagrams: circular arrow diagram, circular motion diagram, arrow ring chart, doughnut chart (donut chart), circle pie chart, diamond pie chart, circle diagram, pie chart, ring chart, loop diagram, block loop diagram, arrow loop circle, crystal diagram, triangular diagram, diamond diagram, pentagon diagram, hexagon diagram, heptagon diagram, cycle diagram (cycle chart), stacked Venn diagram (onion diagram), arrow circle diagram.
Use these shapes to illustrate your marketing and sales documents, presentations, webpages and infographics in the ConceptDraw PRO diagramming and vector drawing software extended with the Target and Circular Diagrams solution from the Marketing area of ConceptDraw Solution Park.
www.conceptdraw.com/ solution-park/ marketing-target-and-circular-diagrams
Circular arrow diagram 1
Circular arrow diagram 1, circular arrow diagram, circular motion diagram,
Circular arrow diagram 2
Circular arrow diagram 2, circular arrow diagram, circular motion diagram,
Arrow ring chart
Arrow ring chart, circular arrow diagram, circular motion diagram,
Doughnut chart
Doughnut chart, doughnut chart, pie chart, ring chart, donut chart,
Diamond pie chart
Diamond pie chart, diamond pie chart, circular diagram,
Pie chart
Pie chart, pie chart,
Circle diagram
Circle diagram, circle diagram, circular diagram,
Circle pie chart 2
Circle pie chart 2, circle pie chart, circular diagram, marketing mix diagram,
Circle pie chart 1
Circle pie chart 1, circle pie chart, circular diagram, marketing mix diagram,
Ring chart 1 - 3 elements
Ring chart 1 - 3 elements, doughnut chart, pie chart, ring chart, donut chart,
Ring chart 1 - 4 elements
Ring chart 1 - 4 elements, doughnut chart, pie chart, ring chart, donut chart,
Ring chart 1 - 5 elements
Ring chart 1 - 5 elements, doughnut chart, pie chart, ring chart, donut chart,
Ring chart 1 - 6 elements
Ring chart 1 - 6 elements, doughnut chart, pie chart, ring chart, donut chart,
Ring chart 1 - 7 elements
Ring chart 1 - 7 elements, doughnut chart, pie chart, ring chart, donut chart,
Ring chart 2 - 3 elements
Ring chart 2 - 3 elements, doughnut chart, pie chart, ring chart, donut chart,
Ring chart 2 - 4 elements
Ring chart 2 - 4 elements, doughnut chart, pie chart, ring chart, donut chart,
Ring chart 2 - 5 elements
Ring chart 2 - 5 elements, doughnut chart, pie chart, ring chart, donut chart,
Ring chart 2 - 6 elements
Ring chart 2 - 6 elements, doughnut chart, pie chart, ring chart, donut chart,
Ring chart 2 - 7 elements
Ring chart 2 - 7 elements, doughnut chart, pie chart, ring chart, donut chart,
Crystal diagram - 3 elements
Crystal diagram - 3 elements, crystal diagram, triangular diagram,
Crystal diagram - 4 elements
Crystal diagram - 4 elements, crystal diagram, diamond diagram,
Crystal diagram - 5 elements
Crystal diagram - 5 elements, crystal diagram, pentagon diagram,
Crystal diagram - 6 elements
Crystal diagram - 6 elements, crystal diagram, hexagon diagram,
Crystal diagram - 7 elements
Crystal diagram - 7 elements, crystal diagram, heptagon diagram,
Stacked Venn diagram - 4
Stacked Venn diagram - 4, stacked Venn diagram, onion diagram,
Stacked Venn diagram - 5
Stacked Venn diagram - 5, stacked Venn diagram, onion diagram,
Stacked Venn diagram - 6
Stacked Venn diagram - 6, stacked Venn diagram, onion diagram,
Stacked Venn diagram - 7
Stacked Venn diagram - 7, stacked Venn diagram, onion diagram,
Basic loop diagram
Basic loop diagram, basic loop diagram,
Block loop diagram
Block loop diagram, block loop diagram,
Arrow loop circle
Arrow loop circle, arrow loop circle,
Arrow loop - 3 circles
Arrow loop - 3 circles, arrow loop diagram,
Arrow loop - 4 circles
Arrow loop - 4 circles, arrow loop diagram,
Arrow loop - 5 circles
Arrow loop - 5 circles, arrow loop diagram,
Arrow loop - 6 circles
Arrow loop - 6 circles, arrow loop diagram,
Arrow loop - 7 circles
Arrow loop - 7 circles, arrow loop diagram,
Arrow circle diagram - 3
Arrow circle diagram - 3, arrow circle diagram,
Arrow circle diagram - 4
Arrow circle diagram - 4, arrow circle diagram,
Stacked Venn diagram - 3
Stacked Venn diagram - 3, stacked Venn diagram, onion diagram,
Arrow circle diagram - 5
Arrow circle diagram - 5, arrow circle diagram,
Arrow circle diagram - 6
Arrow circle diagram - 6, arrow circle diagram,
Arrow circle diagram - 7
Arrow circle diagram - 7, arrow circle diagram,
HelpDesk

How to Create a Timeline Diagram

A Timeline is a chart which displays a project plan schedule in chronological order. A Timeline is used in project management to depict project milestones and visualize project phases and show project progress. The graphic form of a timeline makes it easy to understand critical project milestones, such as the progress of a project schedule. Timelines are particularly useful for project scheduling or project management when accompanied with a Gantt chart. It captures the main of what the project will accomplish and how it will be done. making a project timeline is one of the most important skills a project manager needs have. Making comprehensive, accurate timelines allows you getting every project off in the best way. ConceptDraw DIAGRAM allows you to draw a timeline chart using a special library.
HelpDesk

How to Draw the Different Types of Pie Charts

Using a Pie Chart, you can visually estimate the relative contribution that different data categories contribute to a whole value. The pie chart displays the statistics in a visual format. The main use of pie charts to show comparisons. The larger piece of the pie, the more the value of this value compared to the rest. Various applications of pie charts can be found in business and education. For business, pie charts can be used to compare the success or failure of the goods or services. They may also be used to display the business market share.

Examples of Flowcharts, Org Charts and More

ConceptDraw examples covers a broad spectrum of business graphics categories. We separated all the graphic documents on application areas and had produced multiple solutions for each of them. ConceptDraw provides a wide variety of examples such as flowcharts, organizational charts, business charts, UML diagrams, database and ERD, directional map, network diagrams and lots more. Each solution accommodates 10+ examples that shows specific application cases of a diagram. ConceptDraw STORE is an application for downloading solutions with examples, templates and stencil libraries. Please choose any examples you are interested in, alternatively download them for free; you will need to install ConceptDraw to view them. As you will see, ConceptDraw is very powerful, you can use more than 10000 symbols, examples, and many pre-drawn templates, to create your own spectacular flowcharts, business diagrams, network diagrams and lots more, effortlessly, and in no time at all.
What is ConceptDraw OFFICE

How to Create a Pie Chart

Create a Pie Chart with ConceptDraw software quickly and easily. The simple tutorial helps you learn how to create a pie chart.

segmented cycle diagram, marketing diagrams, circular arrows diagrams Circular Arrows Diagrams

segmented cycle diagram, marketing diagrams, circular arrows diagrams
Circular Arrows Diagrams solution extends ConceptDraw DIAGRAM with extensive drawing tools, predesigned samples, Circular flow diagram template for quick start, and a library of ready circular arrow vector stencils for drawing Circular Arrow Diagrams, Segmented Cycle Diagrams, and Circular Flow Diagrams. The elements in this solution help managers, analysts, business advisers, marketing experts, scientists, lecturers, and other knowledge workers in their daily work.

Percentage Pie Chart. Pie Chart Examples

This sample was created in ConceptDraw DIAGRAM diagramming and vector drawing software using the Pie Charts Solution from Graphs and Charts area of ConceptDraw Solution Park.
This sample shows the Pie Chart of the approximate air composition. You can see the percentage of oxygen, nitrogen and other gases in the air visualized on this Pie Chart.

Basic Diagramming

Create flowcharts, flow charts, and more with ConceptDraw flowchart software.